These technologies provide clean and renewable ways to capture, generate, store and use power. Storing energy for later use helps balance energy production with demand.
Example technologies
- Emissions reduction technologies
- Advanced energy storage
- Directed-energy technologies, which can transfer energy between 2 points without wires
- Large-scale renewable energy generation
- Low-emission alternative fuels, including biofuels
- Small-scale distributed energy harvesting, in which devices or systems power themselves by harvesting energy from the surrounding area
Example applications
These technologies can be used for:
- cheaper renewable energy, including clean energy for industry
- batteries that are cheaper, safer, more powerful and longer lasting
- better large-scale power generation for industry
- a more diverse energy sector and supplies, including directed-energy technology
- alternative fuels for the transportation and agriculture sectors
- regenerative braking systems for vehicles
- alternative liquid fuels, including hydrogen for specialised applications such as aerospace.
Global research trends
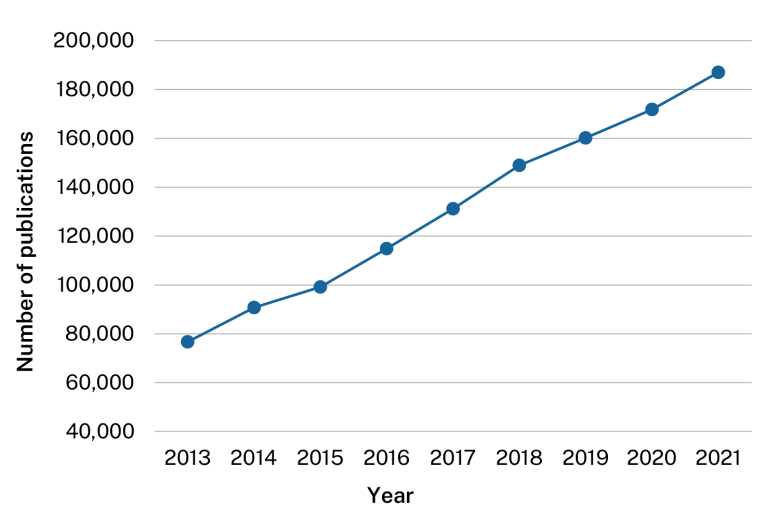
Research into clean energy generation and storage has been growing steadily over the past 10 years, with almost 190,000 research publications published around the world in 2021.
Global research rankings
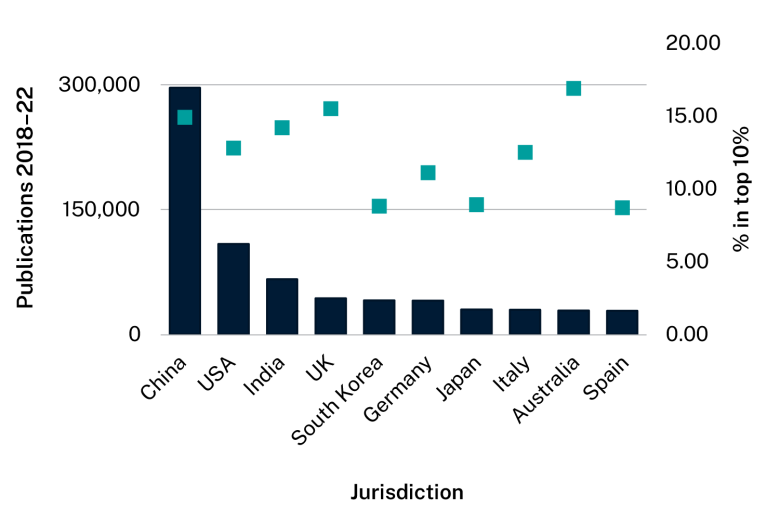
China and the United States do the most clean energy research.
The graph below shows the number of clean energy publications each jurisdiction published between 2018 and 2022. It also shows what proportion of each jurisdiction’s publications were ranked in the top 10% of publications worldwide. This is based on how often the jurisdiction’s publications on core clean energy research subjects were cited.
Clean energy publications by jurisdiction, 2018–22
|
Ranking |
Jurisdiction |
Publications, 2018 to 2022 |
Percentage in top 10% |
|---|---|---|---|
|
1 |
China |
296,187 |
14.9% |
|
2 |
USA |
108,456 |
12.8% |
|
3 |
India |
66,243 |
14.2% |
|
4 |
UK |
43,420 |
15.5% |
|
5 |
South Korea |
40,936 |
8.8% |
|
6 |
Germany |
40,534 |
11.1% |
|
7 |
Japan |
29,775 |
8.9% |
|
8 |
Italy |
29,478 |
12.5% |
|
9 |
Australia |
28,677 |
16.9% |
|
10 |
Spain |
28,276 |
8.7% |
Commercialisation
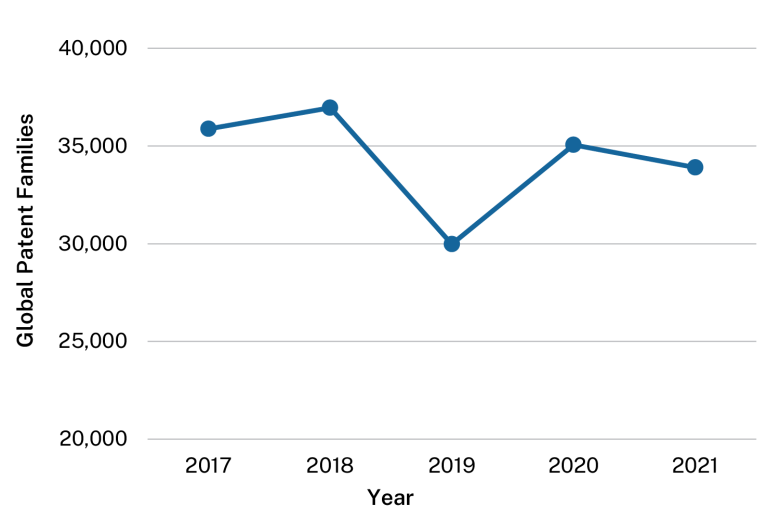
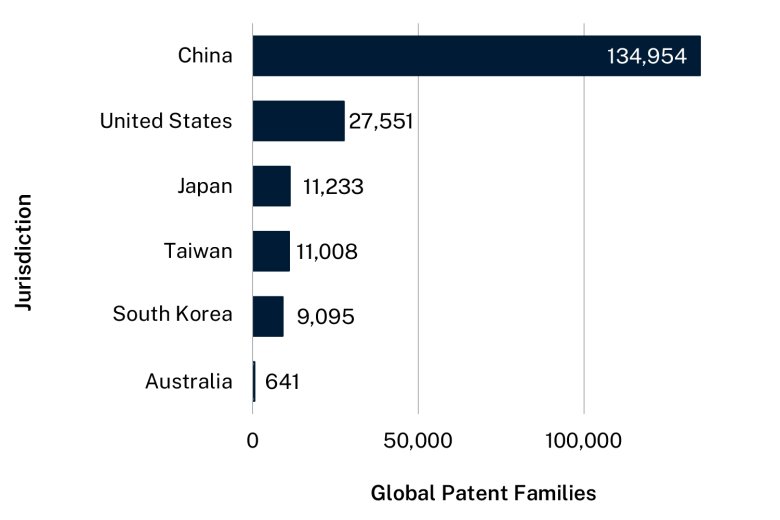
Patent filings are a way to measure how innovation is being commercialised. Patent data can also be used to identify potential collaborators and export markets.
The graphs below show numbers of patent families filed. A patent family is a set of patents filed in different jurisdictions for the same invention.
Clean energy patent families filed globally each year, 2017–2021
|
Year |
Global patent families filed |
|---|---|
|
2017 |
35,877 |
|
2018 |
36,960 |
|
2019 |
29,977 |
|
2020 |
35,060 |
|
2021 |
33,904 |
Jurisdiction of origin for clean energy patent families filed, 2017–2021
|
Ranking |
Jurisdiction |
Global patent families filed |
|---|---|---|
|
1 |
China |
134,954 |
|
2 |
United States |
27,551 |
|
3 |
Japan |
11,233 |
|
4 |
Taiwan |
11,008 |
|
5 |
South Korea |
9,095 |
|
11 |
Australia |
641 |
The Australian industry
Australia has plenty of land, sun and wind, making it an ideal location for clean energy generation. We have signed the Paris Agreement and committed to an emission reduction target of 43% by 2030 and net zero by 2050.
Clean energy research output (number of publications) by state and territory, 2018–2022

- NSW: 34%
- Victoria: 23%
- Queensland: 18%
- ACT: 5%
- Western Australia: 10%
- South Australia: 7%
- Tasmania: 2%
- Northern Territory: 1%
Collaboration
The countries we collaborate with most on clean energy research are China, the United States, the United Kingdom, India and Germany.
Australia’s top 5 global collaborators on clean energy research, 2018–2022
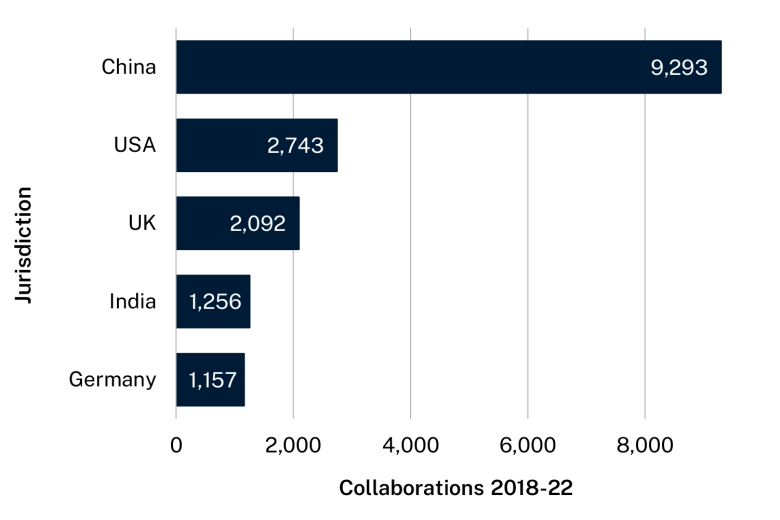
- China: 9,293 publications
- United States: 2,743 publications
- United Kingdom: 2,092 publications
- India: 1,256 publications
- Germany: 1,157 publications
The Australian Government will support Australian industry to help develop international technology standards for clean energy.
The future
Australia is set to become a renewable energy superpower. We have:
- clear skies, a vast coastline and plenty of open spaces
- a secure and reliable source of the minerals the world needs to transition to net zero
- the second-highest potential for solar power production in the world.
More renewable energy generation and storage in Australia will:
- reduce carbon emissions
- help diversify our electricity grid and energy supply
- improve our energy security and resilience to price changes
- allow renewable energy exports to help the world transition to net zero.
But transitioning to clean energy has challenges, including:
- a lack of suitable grid infrastructure
- balancing supply and demand in the grid.
New technologies can improve our grid infrastructure and help ease this transition, with batteries and supercapacitors making the electricity grid more resilient.
Market opportunities
In 2022, 29% of electricity in Australia came from renewables, with 22% generated by wind and solar power.
Australia is the 6th most attractive country for renewable energy investment. Our renewable energy sector is expected to attract over $76 billion in external investment and create more than 600,000 jobs by 2030.
Australia is at the forefront of hydrogen production and was the first to ship liquified hydrogen overseas. We have over 100 hydrogen projects in the pipeline and will be able to export hydrogen to places like Japan, Singapore, India and Korea. Our hydrogen industry could add over $11 billion to GDP and create more than 8,000 jobs by 2050.
Australia's advantages in critical minerals and R&D can diversify and grow our battery industries. Investment in Australia's battery industries could create 34,700 jobs and add $7.4 billion to GDP by 2030.
Data sources
Publication and citation data on this page was collected from Clarivate’s Web of Science and InCites. Data analysis was performed by CSIRO.
Patent data collection and analysis was performed by IP Australia using data from the European Patent Office’s PATSTAT 2022 autumn edition.

