The 2024–25 STEM Influencers Survey by YouthInsight explored perceptions and attitudes to STEM (science, technology, engineering, and mathematics) among educators (teachers and career advisers).
Attitudes and capability in STEM subjects
Explore the interactive dashboard
You can use the interactive data below to compare STEM views among educators across demographic groups and schooling levels, including how confident they are teaching STEM.
Source: YouthInsight 2024–25
Learn more about the data
The Power BI dashboards in the monitor present data in different formats, including charts, graphs and tables. You can customise these dashboards based on what you're interested in.
- Filter the data: Click the options on the left side of each dashboard and make your selections.
- Find more information about a specific data point: Hover your cursor over the dashboard to reveal more information, such as counts or percentages, if available.
- Reset the page to its original selections: Click the button labelled ‘Refresh to default view’ in the bottom left corner of the page.
- Move between different pages in a dashboard: Click the buttons along the top of the dashboard, if available.
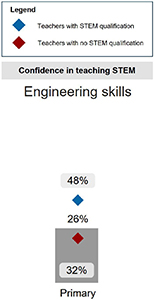
The main bars show the proportion of teachers who agree with each statement about STEM.
The diamonds show the proportion of teachers in the chosen demographic groups who agreed.
For example, this image shows:
- 32% of all primary teachers have confidence in teaching engineering skills
- 48% of primary teachers with STEM qualifications have confidence in teaching engineering skills, compared to 26% of those without STEM qualifications.
The 2024–25 STEM influencer teacher and career advisers survey involved over 800 educators. It asked questions to understand how educators contribute to young people’s perceptions and attitudes to STEM. Respondents came from across Australia.
To ensure survey results represented the population, weighting was corrected for under, or over-representation of sub-groups by:
- socioeconomic deciles of the school or institution the respondent works at
- school jurisdiction (government, Catholic and independent schools)
- geographic representation that aligns to the population of each state or territory in Australia.
Our department commissioned YouthInsight to carry out this survey as part of the Youth in STEM research project. In 2024–25, YouthInsight also surveyed parents to complement the teachers and career advisers survey. YouthInsight will conduct the Youth in STEM survey again in 2025–26.
Refer to the STEM influencer teachers and career advisers survey 2024–25 report for more detailed information and project methodology.
Read the STEM influencer teachers and career advisers survey 2022–23 report.
Read about our methodology.
Data insights
Men educators across all teaching settings (primary, secondary and tertiary) were significantly more likely to have a STEM qualification than women educators (44%, compared to 33%). Secondary teachers of STEM subjects were significantly more likely to have a STEM qualification than those who do not teach STEM subjects (63%, compared to 21%). Among educators across all teaching settings, 66% did not have STEM qualifications.
Across all educators, regardless of whether they teach STEM subjects or not, 97% agreed that STEM skills are important for the Australian economy. Again, across all educators, 90% also thought these skills will help give job security to future workers. These results show no significant differences to the previous educators’ survey (2022–23).
Most educators saw STEM as an integrated set of skills, with all 4 STEM areas important for getting a good job. These results are similar to the 2022–23 survey outcomes and included the views that:
- technology skills are very important (53%)
- mathematics skills are very important (43%)
- science skills are very important (31%)
- engineering skills are very important (20%).
The response scale for the data above included options. In order from most to least favourable, these were:
- very important
- somewhat important
- neither
- somewhat unimportant
- not at all important.
Primary teachers placed significantly more importance on several skills than secondary teachers. Mathematics had the biggest difference (49% compared to 34%), followed by engineering (23% to 14%) and science (33% to 24%), as well as STEM as an integrated set of skills (40% to 31%).
Teachers with STEM qualifications were significantly more likely to identify STEM skills as very important to getting a good job. Of these teachers, 47% said integrated STEM skills are very important, compared to 31% of those without STEM qualifications.
These differences were reflected for each individual skillset except technology. Of educators with STEM qualifications, 58% agreed technology skills are very important to get a good job in the future. This is only slightly higher than the 51% of educators without STEM qualifications who agreed. These results were consistent with the previous survey.
Teachers who were First Nations people were more likely to identify STEM skills as important for future careers than non-First Nations teachers across both primary and secondary teaching settings. Of these First Nations primary and secondary teachers, 100% agreed that STEM was important as an integrated set of skills.
First Nations primary school educators placed more importance on all STEM skills except engineering. Of these non-First Nations teachers, 72% agreed engineering was important compared to 69% of First Nations teachers. Similarly, First Nations STEM secondary educators placed more importance on all STEM skills except science. A total of 81% of non-First Nations secondary STEM teachers agreed was important compared to 73% of First Nations secondary STEM teachers.
Confidence in teaching STEM
For educators across all teaching settings, 91% of men felt qualified to teach at least one STEM topic, compared to 83% of women. This difference was not significant. Across all teaching settings and STEM subject areas, educators felt least qualified to teach engineering, with only 31% saying they felt qualified to teach this subject.
A significantly higher proportion of women than men reported no confidence in teaching STEM subjects (16%, compared to 9%). This result may be impacted by a greater proportion of men educators in the population sample having a STEM qualification and teaching STEM compared to women.
Educators with STEM qualifications were more confident teaching STEM subjects than educators without STEM qualifications. For STEM as an integrated set of skills:
- 79% of primary teachers with STEM qualifications felt confident to teach STEM as an integrated set of skills compared to 58% without STEM qualifications
- 82% of secondary STEM teachers with STEM qualifications felt confident compared to 42% without STEM qualifications
- 95% of tertiary teachers with STEM qualifications felt confident compared to 20% without.
In 2024–25, teachers from regional schools were more confident teaching STEM as an integrated set of skills than teachers from metropolitan schools. This was the same across all teaching settings:
- 64% of primary teachers in regional schools felt confident to teach STEM as an integrated set of skills compared to 61% of primary teachers in metropolitan schools
- 76% of secondary STEM teachers in regional schools felt confident to teach STEM as an integrated set of skills compared to 62% of secondary STEM teachers in metropolitan schools
- 71% of tertiary teachers in regional schools felt confident to teach STEM as an integrated set of skills compared to 62% of tertiary teachers in metropolitan schools.
This is a change from the 2022–23 survey, in which tertiary and secondary STEM teachers from metropolitan schools were more confident teaching STEM as an integrated set of skills than teachers from regional schools.
Gender perceptions of students’ confidence
The survey asked whether girls or boys are more confident in a range of subjects, including STEM.
Most educators believed boys and girls are equally confident in mathematics, science and technology, but not in engineering. They reported that:
- 63% of boys and girls were equally confident in science
- 59% of boys and girls were equally confident in mathematics
- 52% of boys and girls were equally confident in technology
- 34% of boys and girls were equally confident in engineering.
Where educators perceived a gendered difference in confidence, it skewed heavily towards boys. A large proportion of educators perceived that boys were more confident in STEM subjects than girls. A total of 75% of educators believed that boys were more confident in STEM subjects, compared to 13% of educators who believed that girls were more confident. Of all STEM subjects, the difference was largest in engineering, with almost two-thirds of educators (64%) thinking boys are more confident than girls.
Educators reported boys are more confident than girls in:
- engineering – 64% believed boys are more confident, 2% believed girls are more confident
- sport – 57% believed boys are more confident, 0% believed girls are more confident
- technology – 46% believed boys are more confident, 3% believed girls are more confident
- mathematics – 35% believed boys are more confident, 6% believed girls are more confident
- science – 30% believed boys are more confident, 7% believed girls are more confident.
Educators reported girls to be more confident in:
- social science – 40% believed girls are more confident, 4% believed boys are more confident
- arts – 61% believed girls are more confident, 1% believed boys are more confident
- English – 61% believed girls are more confident, 1% believed boys are more confident.
These results are similar to the 2022–23 survey outcomes.
Capacity to give STEM career advice
Among those who provide career advice to students, 43% rated their ability to provide students with advice on STEM pathways as high or very high. A further 40% rated their ability as medium, while 15% rated their ability as low or very low. Women educators rated their ability higher than men (46% high or very high, compared to 34% for men).
Educators were also asked to rate their ability to explain what different STEM careers involve. Of these educators, 27% rated their ability to explain different STEM careers as high or very high. A higher proportion of men (43%) than women (24%) rated their ability as high or very high. Teachers with STEM qualifications were also more likely to say they can explain STEM careers (46%) than those without STEM qualifications (17%). This gap was largest among tertiary teachers. Among tertiary educators with a STEM qualification, 60% rated their ability as high or very high. Of tertiary educators without a STEM qualification, only 23% responded in the same way. These results may reflect the higher proportion of STEM teachers and teachers with STEM qualifications who are men.
Across all teaching settings, educators teaching in higher socio-economic status (SES) (deciles 6–10) areas were significantly more likely to highly rate their ability to explain different STEM careers than educators teaching in lower SES (deciles 1–5) areas. The largest difference was for secondary non-STEM teachers. In this group, 68% of educators from higher SES areas felt they had the ability to explain different STEM careers, compared to 19% of teachers from lower SES areas.
Of all teachers, 69% felt confident connecting STEM content with real-world applications and career examples. Teachers with STEM qualifications were significantly more likely to feel confident compared to those who do not have STEM qualifications (90%, compared to 59%). A significantly higher proportion of secondary teachers (74%) felt confident making STEM connections compared to primary teachers (65%). A significantly higher proportion of men (82%) than women (67%) felt confident.
Gender perceptions about STEM subjects and careers
Explore the interactive dashboard
You can use the data below to compare gender perceptions among educators across demographic groups. Explore educator views on how engaged girls and boys are in STEM subjects and educator perceptions on how suited they are to STEM careers.
Source: YouthInsight 2024–25
Learn more about the data
The Power BI dashboards in the monitor present data in different formats, including charts, graphs and tables. You can customise these dashboards based on what you're interested in.
- Filter the data: Click the options on the left side of each dashboard and make your selections.
- Find more information about a specific data point: Hover your cursor over the dashboard to reveal more information, such as counts or percentages, if available.
- Reset the page to its original selections: Click the button labelled ‘Refresh to default view’ in the bottom left corner of the page.
- Move between different pages in a dashboard: Click the buttons along the top of the dashboard, if available.
The main bars show the proportion of teachers who agree with each statement about STEM.
The diamonds show the proportion of teachers in the chosen demographic groups who agreed.
For example, this image shows:
- 32% of all primary teachers have confidence in teaching engineering skills
- 48% of primary teachers with STEM qualifications have confidence in teaching engineering skills, compared to 26% of those without STEM qualifications.
The 2024–25 STEM influencer teacher and career advisers survey involved over 800 educators. It asked questions to understand how educators contribute to young people’s perceptions and attitudes to STEM. Respondents came from across Australia.
To ensure survey results represented the population, weighting was corrected for under, or over-representation of sub-groups by:
- socioeconomic deciles of the school or institution the respondent works at
- school jurisdiction (government, Catholic and independent schools)
- geographic representation that aligns to the population of each state or territory in Australia.
Our department commissioned YouthInsight to carry out this survey as part of the Youth in STEM research project. In 2024–25, YouthInsight also surveyed parents to complement the teachers and career advisers survey. YouthInsight will conduct the Youth in STEM survey again in 2025–26.
Refer to the STEM influencer teachers and career advisers survey 2024–25 report for more detailed information and project methodology.
Read the STEM influencer teachers and career advisers survey 2022–23 report.
Read about our methodology.
Data insights
STEM gender perceptions by subject
The survey asked teachers about the ease of engaging girls and boys in STEM.
- 66% of all teachers agreed that it’s easier to engage boys in STEM compared to other subject areas. Men teachers were slightly more likely to agree with this (67%) than women teachers (66%). In the previous survey, women teachers were more likely to agree with this.
- 26% of all teachers agreed that it’s easier to engage girls in STEM compared to other subject areas. Men teachers were indicatively more likely to agree with this (37%) than women teachers (23%). In the previous survey, women and men teachers were equally likely to agree with this.
- 28% of all teachers agreed that STEM related careers are more suited to boys than girls. Men teachers were indicatively more likely to agree with this (34%) than women teachers (27%). In the previous survey this was more even, with 23% of men teachers agreeing compared to 22% of women teachers.
STEM gender perceptions by career
When asked the top three STEM careers they recommended to students, engineering was the career educators most recommended for both boys and girls. Recommended roles were similar for boys and girls, with only these significant differences:
- 67% of advisers recommended engineering to boys, while 49% recommended it to girls.
- 32% of advisers recommended science to girls, while 21% recommended it to boys.
- 31% of advisers recommended health-related roles to girls, while 10% recommended it to boys.
When asked if jobs were more for girls or boys, educators strongly associated different genders with different jobs:
- The top three jobs most associated with women were nurse, office support and teacher. These were the same jobs as the previous survey.
- Labourer, trade worker and machinery operator were most associated with men.
- Lawyer, pharmacist and accountant were the jobs with the least gender skew.
The data showed correlation between the gender associations of different jobs and the perceived importance of STEM skills to those jobs:
- Computing or information technology jobs were associated with men and were the jobs where STEM skills were perceived as most essential.
- Pharmacist was the only job associated with women where STEM skills were perceived as essential.
- Nursing was associated with women, with STEM skills perceived as moderately essential.
These results were consistent with the 2025 STEM influencer parent survey.
Teachers with STEM qualifications were more likely to see STEM skills as necessary for teaching compared to teachers without STEM qualifications. However, both groups saw teaching as an occupation associated with women.