Appendix A: Historical emissions

Emission trends to date, and the projections on status quo

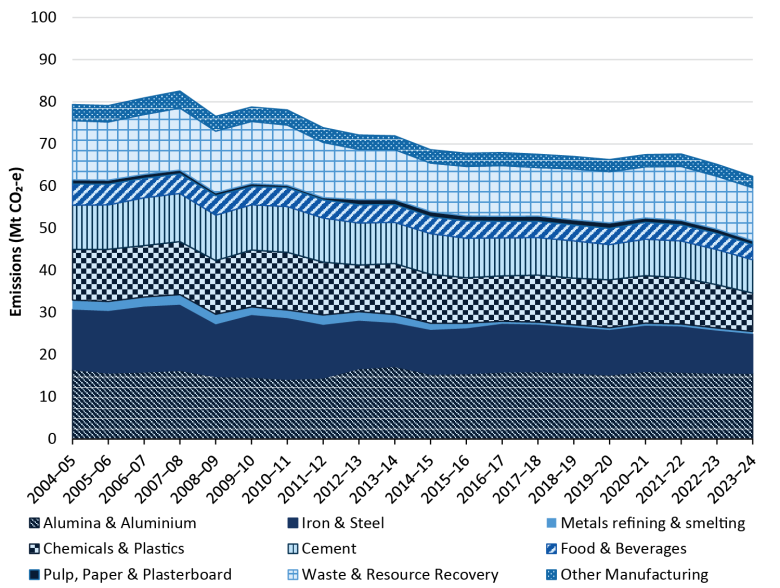
Since 2005, the industrial subsectors direct emissions have decreased slightly, see below. Some of the declines can be attributed to the global financial crisis, particularly in the immediate years following 2007 (House of Representatives, 2009). Other declines in emissions are likely a result of improvements in efficiency as well as the closure of industrial facilities over this period.

Emissions have otherwise remained mostly flat, reflecting a stable period of industrial activity. More recent disruptions triggered by the invasion of Ukraine and the accompanying gas price increases are partly responsible for the decreases in emissions in the years 2022 to 2024. 

To come.

Historic scope 1 emissions of the Industry Sector Plan by subsector from 2005–2024. 

The emissions estimates are based on national emissions reported in the Quarterly Update of Australia’s National Greenhouse Gas Inventory, December 2024 (DCCEEW, 2025a).

An area graph showing the historical emissions by subsector from the financial year 2004–2005 to the financial year 2023–2024. The y axis of the graph is in million tonnes of carbon dioxide equivalent, the x axis in years. The graph shows emissions beginning just below 80, peaking at about 83 in 2007–2008, then slowly receding to be just over 60 in 2023–24. There is no obvious significant change to emissions output any of the subsectors, with the exception of a notable decline in Iron and Steel, and Cement. All other subsectors appear to have minor reductions or plateaued.