Intermediate-level radioactive waste (ILW)

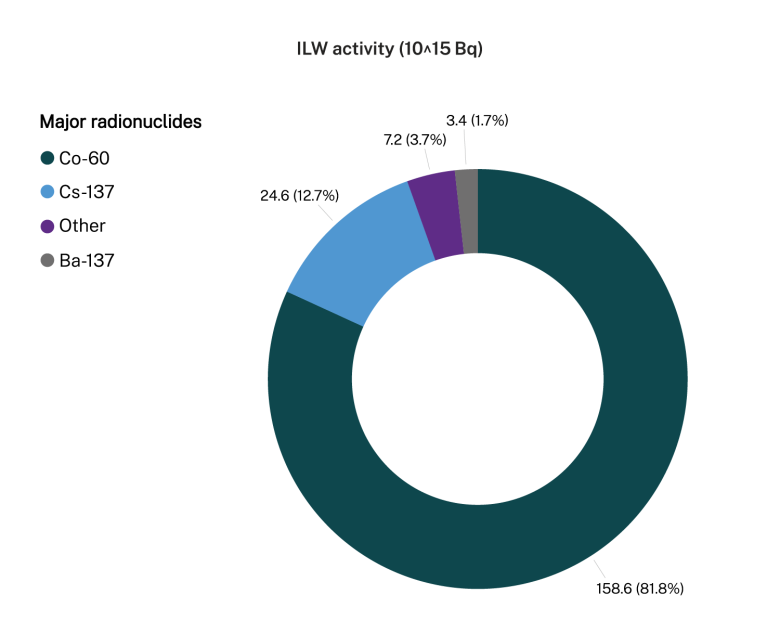
This waste emits higher levels of radiation, needs extra shielding and can remain radioactive for a longer time. 

Examples include waste from nuclear medicine production and some of the waste from operating the OPAL nuclear research reactor in Sydney.
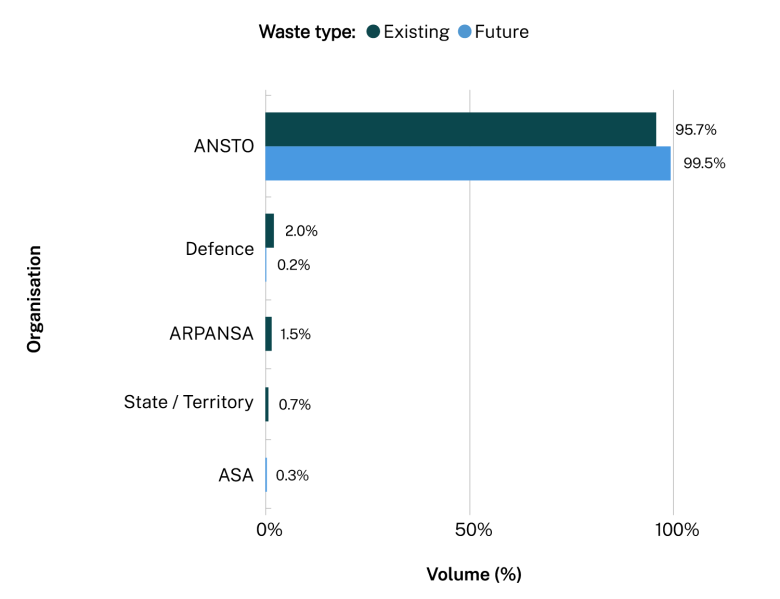
Volumes

The data estimates the waste’s volume after it has undergone future waste conditioning processes, where the waste holder has provided this information. 

Some waste holders provided waste volumes that do not consider future waste conditioning or packaging that disposal may require.

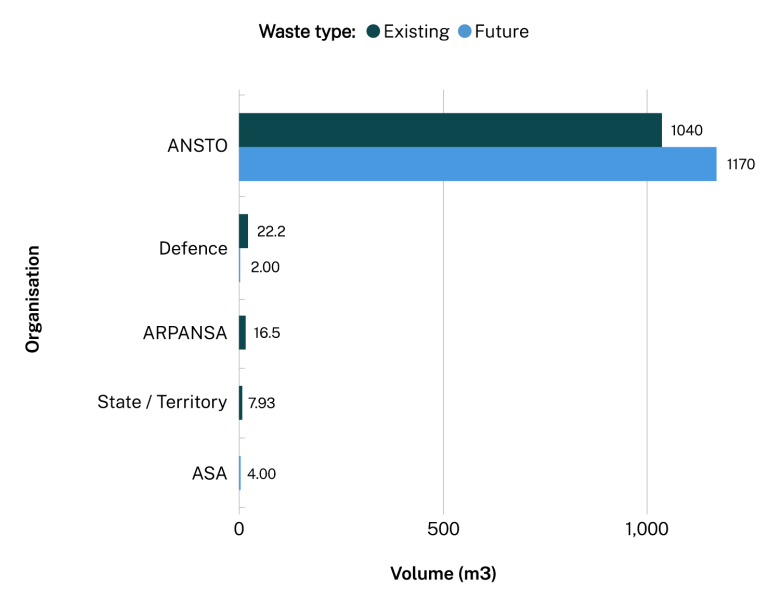
The total numbers in Table 6 are slightly different from Table 1 because we have limited the numbers to 3 significant figures.

Table 6: ILW volume in 2024 inventory, packaged (m3)
Organisation / group Existing Future Total
ANSTO 1,040 1,170 2,210
CSIRO - -  
Defence 22 2 24
ARPANSA 16 - 16
ASA - 4 4
Other Commonwealth government - -  
State and territory government and regulators 8 - 8
Total 1,086 1,176 2,262
Table 7: ILW volume in 2021 inventory (m3)
Organisation / group Existing Future TBD Total
ANSTO 2,198 1,555 - 3,753
CSIRO 62 12 - 74
Defence 2 21 - 23
ARPANSA - 22 - 22
Industry 3 - - 3
Hospital - - 1 1
Other Commonwealth government - 1 - 1
Research and education - - -  
Total 2,265 1,611 1 3,877

Where volume is less than 1m3, we have rounded up to 1m3.

Figure 7 and Figure 8 show the volumes of ILW held by the different organisational groups, and what proportion each organisational group holds of the total inventory of ILW. ANSTO and Defence hold the majority of ILW waste.

LLW volumes m3 by organisation. Data table on next tab.

The volumes of ILW held by each organisational group in the 2024 inventory, separated by existing and future waste.

2024 ILW volumes (m3) by organisation
Organisation Volume (m3) Existing waste / Future waste
ANSTO 1171.82 Future
ANSTO 1037.75 Existing
Defence 22.185 Existing
ARPANSA 16.48 Existing
State / territory 7.925 Existing
ASA 4 Future
Defence 2 Future
Total ILW volume percentages by organisations. Data table on next tab.

The percentage of total ILW held by each organisational group in the 2024 inventory, separated by existing and future waste.

2024 ILW volume % by organisation
Organisation % of ILW Volume by Organisation Existing waste / Future waste
ANSTO 99.49% Future
ANSTO 95.70% Existing
Defence 2.05% Existing
ARPANSA 1.52% Existing
State / territory 0.73% Existing
ASA 0.34% Future
Defence 0.17% Future

Radioactivity

Table 8: ILW activity in 2024 inventory (MBq)
Organisation / group Existing Future Total
ANSTO 178,000,000,000 15,400,000,000 193,400,000,000
CSIRO 74,300 - 74,300
Defence 373,000,000   373,000,000
ARPANSA 1,040,000 - 1,040,000
Other Commonwealth government 30,500 - 30,500
State and territory government and regulators 392 1 393
Total 178,374,145,192 15,400,000,0001 193,774,145,193

Like in 2021, the 2024 ILW inventory in Table 6 does not include nuclear materials. We discuss these in another section of the report.

Percentage of total 2024 ILW activity by organisation. Data table on next tab.

The percentage of total activity attributed to the ILW held by each organisational group in the 2024 inventory, separated by existing and future waste.

% of total 2024 ILW activity by organisation
Organisation % of ILW activity by organisation Existing waste / Future waste
ANSTO 100.00% Future
ANSTO 99.79% Existing
Defence 0.21% Existing
ARPANSA 0.00% Existing
CSIRO 0.00% Existing
Other Commonwealth government 0.00% Existing
State / territory 0.00% Existing
State / territory 0.00% Future

Uncertainties

Waste holders have estimated ILW volumes incorporating assumptions about future treatment and conditioning processes required for disposal.

There is significant uncertainty on estimated volume for some waste streams.

We have based the total ILW activity on reported values. However:

  • some waste streams included estimates on volume but not activity
  • some waste streams included estimates on activity not volume
  • estimating radioactivity is particularly uncertain due to the nature of radioactive decay
  • we have limited the numbers to 3 significant figures to reflect the uncertainties.

Radionuclide breakdown

These figures only include the waste streams where we received radionuclide activity values. The activity values are expressed as multiples of ten to the power n. For example, 2x10³ is 2x10x10x10 = 2000. 

Cobalt-60 (Co-60) is the biggest contributor of radioactivity in the ILW waste streams. 

Co-60 is commonly produced in components of nuclear reactors. This is where the stable isotope cobalt-59, contained in metal structures, is exposed to neutrons and converted to Co-60. 

Figure 10 and Figure 11 show the radionuclide activity within the total ILW activity in the 2024 report.  

Figure 10 shows the main radionuclides that contribute most of the activity in the ILW waste streams. Figure 11 displays the ‘Other’ radionuclides featured in Figure 10. There are other radionuclides with even lower activity that we have not included in Figure 11.

ILW activity by major radionuclides. Data table on next tab.

The total activities (1015 Bq) of the other radionuclides for ILW in the 2024 inventory.

2024 ILW activity (10^15 Bq) by major radionuclides
Major radionuclides Activity (10^15 Bq)
Co-60 158.6099
Cs-137 24.62835
Other 7.173255
Ba-137 3.389844
Total ILW activity by other radionuclides. Data table on next tab.

The total activities (1015 Bq) of the other radionuclides for ILW in the 2024 inventory.

2024 ILW activity (10^15 Bq) by other radionuclides
Activity (10^15 Bq)  Other radionuclides
0.832177728 Zn-65
0.663649472 Cr-51
0.524747072 Nb-95
0.48001974 H-3
0.457955297 Zr-95
0.412109375 Fe-55
0.404574146 Pr-144
0.399656345 Pm-147
0.396806184 Ce-144
0.344336803 Sr-90
0.344336803 Y-90
0.219663485 Am-241
0.155319237 Eu-154
0.132752214 Ru-103
0.112769962 Rh-103m
0.110224463 Te-127m
0.107021084 Eu-152
0.107008961 Ni-59
0.087569355 Rh-106
0.085687837 Sb-125
0.083920414 Ru-106
0.083436909 Te-127
0.075687173 I-132
0.073589607 Te-132
0.072969437 C-14
0.043199807 I-131
0.035483125 Ba-137m
0.032082375 Te-123m
0.031222249 Cs-143
0.029728482 Cs-134
0.027121276 Cm-244
0.026231331 Mo-99
0.025695703 Tc-99m
0.025262478 U-235
0.02006777 Te-125m
0.016813855 Te-129m
0.014960417 Am-243
0.012019462 Fe-59
0.010226101 Tc-99
0.010087093 Te-129
0.007285214 Ce-141
0.007084413 Xe-131m
0.005370227 Pr-144m
0.00446948 Eu-155
0.003873431 Nb-95m
0.00354836 Pu-239
0.003010872 Pu-240
0.00215927 Sn-123
0.001819811 Y-91
0.001416366 Te-121
0.000952374 Zr-93
0.00084009 Te-121m
0.000734509 La-140
0.00054441 Ba-140
0.000363962 Sr-89
0.000350372 Cs-135
0.000344637 Sm-151
0.000238227 Sn-126
0.000180689 Rh-105
0.000172606 Se-79
6.11E-05 Ta-182
5.38375E-05 Te-131
4.12606E-05 Np-237
0.00004083 Be-7
3.34351E-05 Pd-107
1.92298E-05 Pu-238
1.68498E-05 Sc-46
1.49696E-05 Ni-63
7.59918E-06 Co-58
5.87891E-06 Cu-66
5.3701E-06 MN-54
1.50682E-06 Th-232
1.17896E-06 Ag-110m
6.97E-07 Cm-245
6.50E-07 Nb-96
3.55E-07 U-238
3.25E-07 Ra-226
1.10E-07 Cl-36
5.51E-08 I-129
3.64E-08 Nb-94
1.38E-08 Cm-243
1.31E-08 Pu-242
1.06E-08 Pu-241
4.69E-09 Cm-242
2.03E-09 Mo-93
1.75E-09 Pa-231
7.89E-10 U-234
2.14E-10 U-236
2.01E-10 Ag-108m
2.38E-11 U-232
1.51E-11 Ca-41
1.77E-12 Th-229
1.79E-14 U-233