Snapshot of disparity in STEM

Australia’s talent pool is limited by the underrepresentation of half of Australia’s population – girls and women – in STEM education and careers. The causes of poor attraction and retention of girls and women in STEM begin from an early age and compound as progression to more senior careers is made. Often referred to as a ‘leaky pipeline’, the result is a system with low representation of women in STEM education, workplaces, and senior level leaders, and a society that undervalues the opportunities and contributions a career in STEM can provide for girls and women. Differing participation rates in STEM education and fields also means that gender inequities can transpire at different points of the career path depending on the individual field.

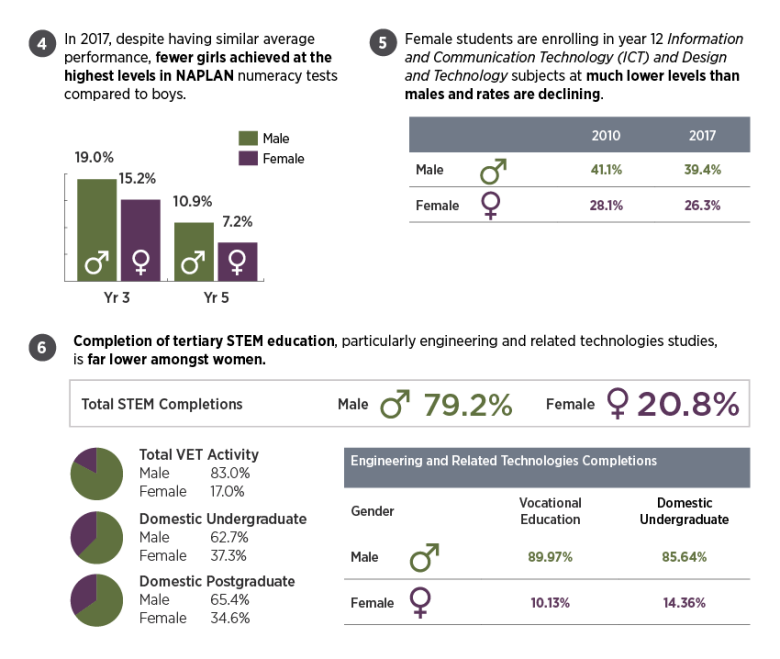
At the school-level, despite boys and girls having similar average performance in the National Assessment Program – Literacy and Numeracy (NAPLAN), in 2017 fewer girls achieved at the highest levels in NAPLAN year 3 and 5 numeracy tests compared to boys.[7] By year 12, there are marked participation differences in a number of STEM subjects. For example, while girls comprise over 50 per cent of enrolments in year 12 Sciences subjects, they are underrepresented in Information and Communication Technology and Design and Technology subjects with only 26.3 per cent of year 12 girls enrolling in 2017 compared to 39.4 per cent of year 12 boys.[8] In year 12, boys outnumber girls 3 to 1 in physics and almost 2 to 1 in advanced mathematics.[9] Low participation in these critical subjects directly impacts future opportunities for girls, whether in a STEM career or not, and is a major contributor to the gender imbalance in STEM tertiary education and the STEM workforce.

At the tertiary level, both at universities and in vocational education and training (VET), underrepresentation in information technology (IT) and engineering education is of particular significance, especially as these skills will be increasingly important as Australia transitions to a digital and technologically-driven economy. In 2016, women comprised less than 15 per cent of domestic Engineering and Related Technologies undergraduate course completions[10],[11] and less than 11 per cent of vocational education course completions.

While participation rates in other broad fields of tertiary STEM education such as the Natural and Physical Sciences may not present cause for concern at the surface level, deeper examination also shows underrepresentation of women in more specific fields of education such as Mathematical Sciences (37 per cent of domestic undergraduate and postgraduate completions in 2016) and Physics and Astronomy (29 per cent of domestic undergraduate and postgraduate completions in 2016).[12] Comparison of enrolment and completion data indicates most women who enter into these fields of education complete their courses, suggesting issues other than attrition are of importance during this stage of the career.[13]

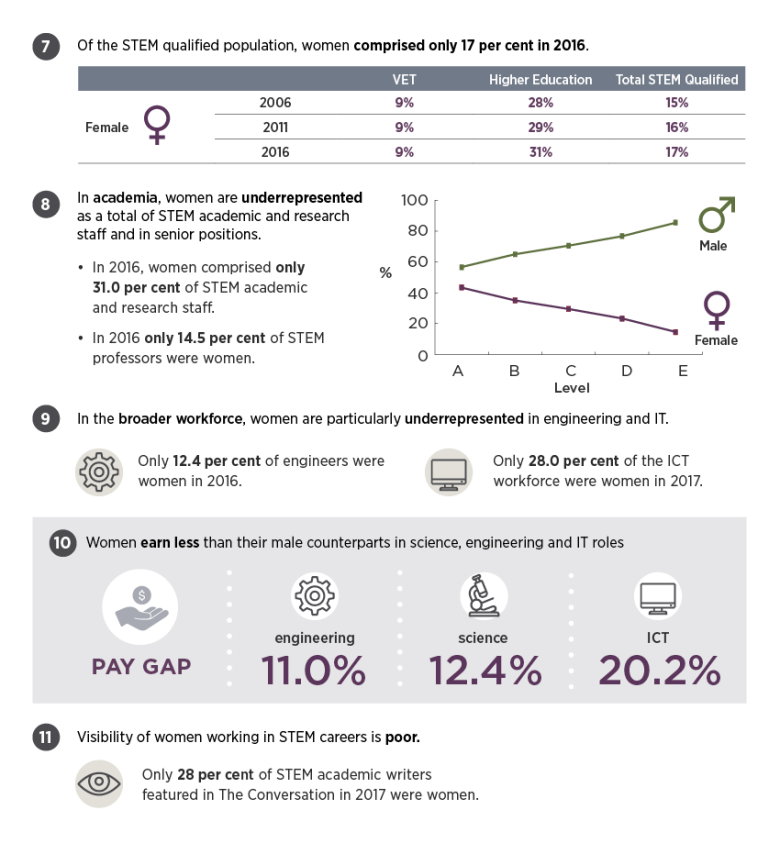
Consistent low levels of participation in STEM education means the number of women participating in the STEM workforce is not increasing at a substantial rate. Of the STEM qualified population, women comprised only 17 per cent in 2016.[14] In academia, participation at junior levels is not an issue for all STEM fields, however women are still poorly represented as a total of STEM academics (31 per cent in 2016).[15] Representation of women at senior levels (14.5 per cent in 2016) is extremely poor, even for traditionally female dominated fields such as biology – in 2016, women comprised 56 per cent of postdoctoral biology academics, but only 18 per cent of professors.[16] These issues are not specific to academia and cut across much of the STEM workforce. In engineering, women represented only 12.4 per cent of the workforce in 2016, with men more likely to be employed at higher levels of responsibility and women at less senior levels.[17],[18] In IT, women are also poorly represented in higher positions and made up only 28 per cent of the workforce in 2017, a figure that has remained unchanged since 2015.[19] This trend of workforce distribution, with the compounding factors of low participation rates, more women working at lower levels than in senior positions and high levels of midcareer attrition due to these factors, also results in a gender pay gap for STEM. This ranges from 11 per cent in engineering and 12.4 per cent in science, to 20.2 per cent in IT.[20]

What is causing this disparity?

Issues of women’s participation are not exclusive to STEM fields. In the Australian workforce, women have lower work participation rates than men and also earn less than men, with the weekly pay gap currently at 14.2 per cent (average weekly ordinary time earnings for full-time employees).[21] Women’s participation is lower for a variety of reasons, from cultural barriers in the workplace through to women being more likely to be a primary carer for children or other family members. As at January 2019, there is a 9.3 percentage point difference between men (83.0 per cent) and women (73.6 per cent) labour force participation for persons aged 15 to 64 years.[22]

Girls and women, especially those from minority groups, rural and remote areas and disadvantaged backgrounds, face multiple barriers to STEM participation and as a result have to overcome more challenges than their male counterparts.[23],[24] Factors such as bias and stereotyping, career insecurity, a lack of flexible work arrangements, and lack of female role models have been demonstrated to greatly influence girls and women’s decisions to enter and remain in STEM education and careers.[25],[26]

Experiences of bias and stereotyping begin early in life and have a significant impact on girls and women’s development of confidence and interest in STEM.[27],[28] The perception that some STEM fields are a better fit for males, particularly by influencers such as parents, educators, and career counsellors, is one of the biggest barriers to girls and women participating and persisting in STEM.[29]

A lack of diverse female role models in STEM, whether in the classroom, at work or on the screen, further decreases girls’ and women’s likelihood of persisting in STEM education and considering STEM as a career option. For girls, female role models are crucial to their perception of whether they could work in STEM.[30] In fields where women are particularly underrepresented such as physics and engineering, surveys have found more than 80 per cent of women perceive a lack of female role models as a significant hurdle for gender equity in their field.[31]

Working conditions and job insecurity have a strong negative impact on women entering into and maintaining careers in STEM, and are longstanding issues. STEM employees encounter less flexible working conditions, large numbers of short-term contracts, grant dependent positions, and pathways to promotions that can be subject to gender bias. Particularly in academia, finding ongoing positions (tenure) can be very difficult. Additionally, the pathway to senior positions in STEM academia and industry has traditionally been seen as one where there are no career breaks or access to part-time duties, with STEM professionals reporting that taking maternity leave is detrimental to their careers.[32]

In many STEM fields, maintaining skill sets and professional networks are vital to career progression, however gendered caring expectations and different work place approaches to facilitating part-time work make opportunities to undertake training to re-learn, maintain or gain new skills and attendance at networking events or conferences difficult. A further lack of support networks, including mentors, career sponsors and professional groups, contributes to women feeling out of place in STEM fields, and can lead to thoughts about leaving the field.[33] Feeling like a misfit, or an imposter, hinders achievement, engagement, and persistence in STEM education and careers, and causes girls and women to question their abilities and interest in STEM.[34]

Understanding the STEM journey for women

A women’s journey through STEM can be impacted by many factors. The following infographic represents where known pressures and key influencers (who can help or hinder progression) first appear, noting many of these continue throughout the education and career path once they are present and may be experienced differently by individuals.

Women in STEM at a glance

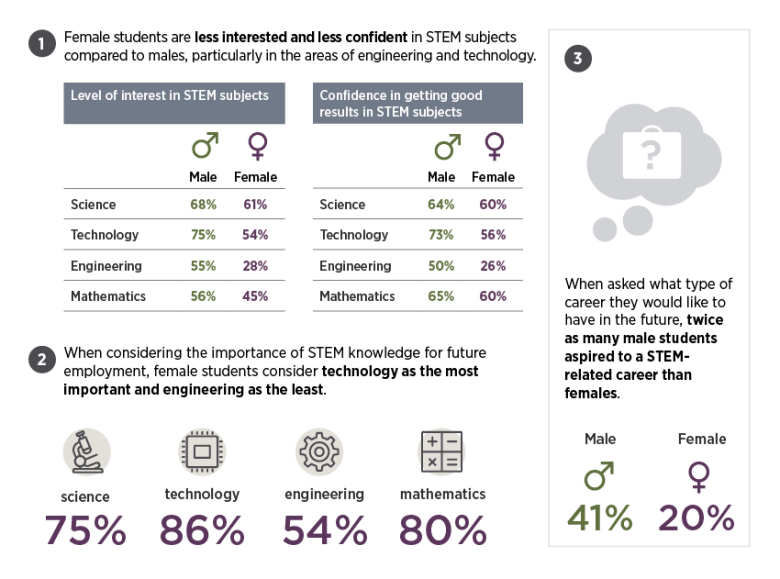
Differences in interest and confidence in STEM appear early, and are particularly concerning for information technology and engineering

This infographic shows data about the differences in interest and confidence in STEM

Female students are participating in STEM education at significantly lower rates than males

This infographic shows data about participation in STEM

Women are poorly represented in the STEM workforce and earn less than their male counterparts

This infographic shows data about gender representation in the STEM workforce

Explanatory notes

1. Student Edge, 2019, Youth in STEM Research, published 8 March 2019.

The Department of Industry, Innovation and Science commissioned a survey to be carried out by Student Edge on young Australians’ attitudes towards and perceptions of STEM. The survey asked more than 2000 students, aged between 12 and 25 years old, questions to establish a national benchmark of young Australians’ awareness and perception of STEM subjects and careers, and particularly focuses on the difference between male and female students. Results were weighted to ensure the population of interest was accurately represented, and respondents came from all states and territories across Australia.

Students were asked about their level of interest in specific STEM subjects. More than 1800 students from across high school and university responded, with results indicating that female students have significantly lower interest across science, technology, engineering and maths. A similar number of responses to the question ‘how confident do you feel that you can study and get good results in each of the following subjects?’ showed that boys and girls have similar levels of confidence in science and maths. However, girls have significantly less confidence in technology and engineering.

2. Student Edge, 2019, Youth in STEM Research, published 8 March 2019.

More than 1000 female students from across high school and university responded to the question ‘Thinking about getting a good job in the future, how important do you believe it is to have knowledge and skills related to each of the subjects that make up STEM?’. Responses indicate that girls see technology as the most important subject to study for gaining future employment, with 86 per cent stating it is ‘very’ or ‘somewhat’ important. Girls see engineering as the least important with only 54 per cent stating it is ‘very’ or ‘somewhat’ important, significantly lower than male students with 65 per cent.

3. Student Edge, 2019, Youth in STEM Research, published 8 March 2019.

Students were asked what type of career they would like to have in the future, with more than 1400 responses. Forty-one per cent of male students who responded selected ‘a STEM-related career,’ significantly higher than only 20 per cent of female respondents.

4. Australian Curriculum, Assessment and Reporting Authority 2017, NAPLAN Achievement in Reading, Persuasive Writing, Language Conventions and Numeracy: National Report for 2017, ACARA, Sydney, accessed 7 February 2019.

The National Assessment Program – Literacy and Numeracy (NAPLAN) is an annual assessment for all Australian students in years 3, 5, 7 and 9. The numeracy component tests students in number and algebra; measurement and geometry; and statistics and probability. NAPLAN has an achievement scale with ten “bands”, which represent increasing complexity of knowledge and skills. Six of the bands are used for reporting student performance at each year level. The year 3 report shows bands 1 to 6, the year 5 report shows bands 3 to 8, the year 7 report shows bands 4 to 9, and the year 9 report shows bands 5 to 10. The highest recorded achievement band is Band 6 for year 3 and Band 8 for year 5. Data shown reflects the proportion of students achieving in or above these bands, split by gender.

5. Australian Curriculum, Assessment and Reporting Authority 2017, National Report on Schooling data portal, accessed 7 February 2019.

The percentage of year 12 students enrolled in Information and Communication Technology and Design and Technology subjects are calculated as the percentage of total year 12 full-time students. Refer to the Australian Curriculum, Assessment and Reporting Authority website for further information.

6. Department of Education and Training uCube – Higher Education Data Cube, accessed 7 February 2019; National Centre for Vocational Education Research – VOCSTATS, extracted on 4 October 2018.

Department of Education and Training cube data are based on selected higher education micro data collected through the Higher Education Statistics Collections. Cube data records students who have requested their gender to be recorded as neither male nor female as female. University data refers to domestic graduates in STEM degrees. Undergraduate completions data includes: Bachelor’s Graduate Entry; Bachelors Honours and Bachelor’s Pass degrees. Postgraduate completions data includes: Doctorate by Coursework; Doctorate by Research; Higher Doctorate; Masters by coursework; Masters by research. Vocational educational data refers to all completions in STEM courses. Total VET Activity refers to Total VET Activity for STEM vocational education completions. Broad STEM fields of education included in analysis: Natural and Physical Sciences, Information Technology, Engineering and Related Technologies, Agriculture Environmental and Related Studies.

7. Office of the Chief Scientist, 2019 (unpublished calculations)

Refer to the report on Australia's STEM Workforce for STEM qualifications included in analysis.

8. Department of Education and Training special data request, 2018. Department of Industry, Innovation and Science calculations.

Department of Education do not collect data on field of research. This calculation uses proxy data based on the STEM field that staff are teaching in, which is calculated using the Academic Organisation Unit from the student data and mapping this to the staff data. Because of this limitation, a small percentage of staff data cannot be mapped to a field of teaching. (This mapping is only valid where staff have either a teaching or teaching/research function, it is not valid for research only staff). Staff numbers only include full-time and fractional full time staff, casual staff counts are not available. STEM teaching fields included in analysis: Agriculture, Agriculture Environmental and Related Studies, Biological Sciences, Chemical Sciences, Civil Engineering, Computer Science, Earth Sciences, Electrical and Electronic Engineering and Technology, Engineering and Related Technologies, Environmental Studies, Fisheries Studies, Geomatic Engineering, Information Systems, Information Technology, Mathematical Sciences, Mechanical and Industrial Engineering and Technology, Natural and Physical Sciences, Other Agriculture Environmental and Related Studies, Other Engineering and Related Technologies, Other Information Technology, Other Natural and Physical Sciences, Physics and Astronomy, Veterinary Studies.

9. Kaspura, Andre, 2017, The Engineering Profession: A Statistical Overview, Thirteenth Edition, February 2017, Engineers Australia, viewed 17 January 2019. Australian Computer Society, Australia’s Digital Pulse - Driving Australia’s international ICT competitiveness and digital growth, ACS, 2018, viewed 2 February 2019.

10. Professionals Australia Gender and Diversity, All Talk: Gap between policy and practice a key obstacle to gender equity in STEM, 2018, Professionals Australia, viewed 2 February 2019.

The Professional Scientists Remuneration Survey tracks annual changes in compensation for full-time employees in Australia. The survey was conducted online during May/June 2018. Invitations to participate were forwarded to member societies of Science & Technology Australia and scientist members of Professionals Australia. The survey was conducted online during May/June 2018. Completed valid questionnaires were returned by 1,202 respondents and have been used as the basis for the analysis contained in this report. Refer to publication for further information.

11. Kennihan, Sarah, 2018, Who writes science and technology stories? More men than women, The Conversation, August 2018, viewed 8 January 2019.

At the end of 2017 the Conversation assessed a year’s worth of stories: 584 articles. Some were written by a single academic, others featured two, three and occasionally more. Overall, 681 authors were involved – 489 men, and 192 women. Refer to publication for further details.

Footnotes

  1. Australian Curriculum, Assessment and Reporting Authority 2017, NAPLAN Achievement in Reading, Writing, Language Conventions and Numeracy: National Report for 2017, ACARA, Sydney.
  2. Australian Curriculum Assessment and Reporting Authority National Report, Year 12 Enrolments, 2017, viewed 7 February 2019.
  3. Office of the Chief Scientist, Science, Technology, Engineering and Mathematics: Women in STEM, Office of the Chief Scientist, Canberra, 2016, viewed 18 January 2019.
  4. Department of Education and Training, uCube – Higher Education Data Cube, Department of Education and Training, Canberra, viewed 7 February 2019.
  5. National Centre for Vocational Education Research, VOCSTATS Resources, extracted on 4 October 2018.
  6. Department of Education and Training, uCube – Higher Education Data Cube, Department of Education and Training, Canberra, viewed 7 February 2019.
  7. Department of Education and Training, uCube – Higher Education Data Cube.
  8. Office of the Chief Scientist 2019 (unpublished calculations).
  9. Department of Education and Training special data request (2016). Department of Industry, Innovation and Science calculations.
  10. Ibid (Department of Education and Training special data request 2018).
  11. Kaspura, A, The Engineering Profession: A Statistical Overview 3rd Edn., Engineers Australia, 2017, viewed 21 January.
  12. Australian Professionals Engineers Australia 2017, Professional Engineers Employment and Remuneration Report, APEA, Melbourne.
  13. Australian Computer Society, Australia’s Digital Pulse - Driving Australia’s international ICT competitiveness and digital growth, ACS, 2018, viewed 2 February 2019.
  14. Professionals Australia Gender and Diversity, All Talk: Gap between policy and practice a key obstacle to gender equity in STEM, 2018, Professionals Australia, viewed 2 February 2019.
  15. Australian Bureau of Statistics, Average Weekly Earnings, November 2018, cat no. 6302.0, viewed 12 February 2019.
  16. Australian Bureau of Statistics, Labour Force, Australia, January 2019, cat. no. 6202.0, seasonally adjusted, persons 15 years and over, viewed 13 February 2019.
  17. Hughes BE 2018, Coming out in STEM: Factors affecting retention of sexual minority STEM students. Science advances, 4(3).
  18. Estrada M, Burnett M, Campbell AG, Campbell PB, Denetclaw WF, Gutiérrez CG, Hurtado S, John GH, Matsui J, McGee R, Okpodu CM 2016, Improving underrepresented minority student persistence in STEM. CBE—Life Sciences Education, vol. 15, no.3.
  19. Dee, T & Gershenson, S, Unconscious Bias in the Classroom: Evidence and Opportunities, Google Inc., California, 2018, viewed 2 February 2019.
  20. Professionals Australia Gender and Diversity, All Talk: Gap between policy and practice a key obstacle to gender equity in STEM.
  21. Ceci, SJ et al. 2009, Women’s underrepresentation in science: Sociocultural and biological considerations, Psychological Bulletin, 135, p. 218–261.
  22. Dee, T & Gershenson, S, Unconscious Bias in the Classroom: Evidence and Opportunities.
  23. Google Inc. & Gallup Inc. Diversity Gaps in Computer Science: Exploring the Underrepresentation of Girls, Blacks and Hispanics, 2016, viewed 2 February 2019.
  24. Harvey-Smith, L, The hunt for the Superstars of STEM to engage more women in science, The Conversation, May 2017, viewed 12 February 2019.
  25. Vila-Concejo, A., Shari L. Gallop, Sarah M. Hamylton, Luciana S. Esteves, Karin R. Bryan, Irene Delgado-Fernandez, Emilia Guisado-Pintado, Siddhi Joshi, Graziela Miot da Silva, Amaia Ruiz de Alegria-Arzaburu, Hannah E. Power, Nadia Senechal & Kristen Splinter 2018, Steps to improve gender diversity in coastal geoscience and engineering, Palgrave Communications, p. 4.
  26. Professionals Australia Gender and Diversity, All Talk: Gap between policy and practice a key obstacle to gender equity in STEM.
  27. Shedlosky-Shoemaker, R & Fautch, J 2015, Who Leaves, Who Stays? Psychological Predictors of Undergraduate Chemistry Students’ Persistence, Journal of Chemical Education, vol. 92, no. 3, pp. 408-414.
  28. <Dasgupta, N & Stout, J 2014, Girls and Women in Science, Technology, Engineering and Mathematics: STEMing the tide and Broadening Participation in STEM Careers, Policy Insights from the Behavioural and Brain Sciences, vol. 1, no. 1, pp. 21-29.