Resources and energy quarterly: September 2024

Date published:
30 September 2024

Introduction

The Resources and Energy Quarterly (REQ) contains the Office of the Chief Economist’s forecasts for the value, volume and price of Australia’s major resources and energy commodity exports.

The publication provides:

  • a 2-year outlook for global commodity prices, demand and supply
  • up-to-date global production and consumption data
  • forecasts for Australian production, exports, volumes and prices of key resources and energy commodities
  • reviews of relevant topics and issues, such as the current outlook for China and the global battery supply chain
  • detailed statistical tables.


Explore the interactive data

Use Power BI to build your own charts and tables.

Forecast data

Predicted commodity values and volumes.

Historical data

Commodity value and volume data from past years.

Overview

Latest developments

Australian resources and energy exports are forecast to continue to ease after the record peak seen in 2022–23.

  • The near-term outlook for Australian resource and energy commodity exports has worsened in net terms since the June 2024 REQ. Economic growth in the major Western economies remains constrained by tight monetary policy. China’s economy remains impacted by a weak property sector. But the outlook is for an improvement in world economic growth in 2025 and 2026.
  • The rising AUD/USD and lower commodity prices are forecast to see Australia’s resource and energy exports decline to $372 billion in 2024–25, down from $415 billion in 2023–24. A further decline to $354 billion is forecast in 2025–26.
  • The gold price has hit a new record high, but iron ore prices have declined as the Chinese property sector remains weak. Nickel and lithium prices remain weak.
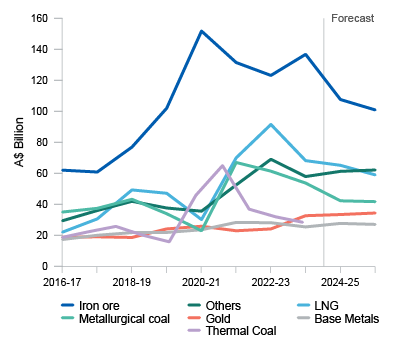
This chart shows Australia’s annual resource and energy export values (in A$ billions) for each major resources and energy commodity from 2016–17 to 2024–25.

This chart shows Australia’s annual resource and energy export values (in A$ billions) for each major resources and energy commodity from 2016–17 to 2024–25. 

The chart shows the 2 waves of resource and energy export earnings that Australia has experienced since the COVID-19 pandemic. The first wave occurred in 2021, as iron ore prices pushed to record highs following China's reopening. The second wave of revenues came from the spectacular surge in energy prices in 2022, which originated from the fallout over Russia's invasion of Ukraine. Higher energy prices lead to record high earnings for coal and LNG.

Macroeconomic outlook

Latest developments

The International Monetary Fund’s July forecast for world economic growth in 2024 was unchanged from its April outlook at 3.2%. Growth in 2025 is forecast to pick up slightly.

  • The outlook for the global economy in 2024 and 2025 is stable, but near-term risks have risen because of services inflation in some economies. 
  • Global industrial production continued to recover in the June quarter 2024, but forward indicators of global manufacturing point to a moderation in industrial activity over the second half of the year.
  • China recorded a weak June quarter GDP growth, as ongoing property sector weakness continued to weigh on activity and investment.
REQ Sept 2024 Macroeconomic outlook

Iron ore and steel

Latest developments

Iron ore prices have fallen by around a third since the start of the year. The weakness is the result of weak global demand (driven by China’s ongoing property sector downturn) and high iron ore stockpiles.

  • In the September quarter, spot iron ore prices fell to 2-year lows because of weakness in global steel demand and falling steel production in China. 
  • Australian export volumes reached record levels in the June quarter because of improved productivity and production ramp-ups at new mines. Export volumes are forecast to increase by 1.7% annually over the next 2 years. 
  • Lower prices projected over the outlook period will reduce Australia's iron ore export earnings by about $30 billion this year, from $138 billion in 2023–24 to $107 billion in 2024–25, easing to $99 billion in 2025–26.

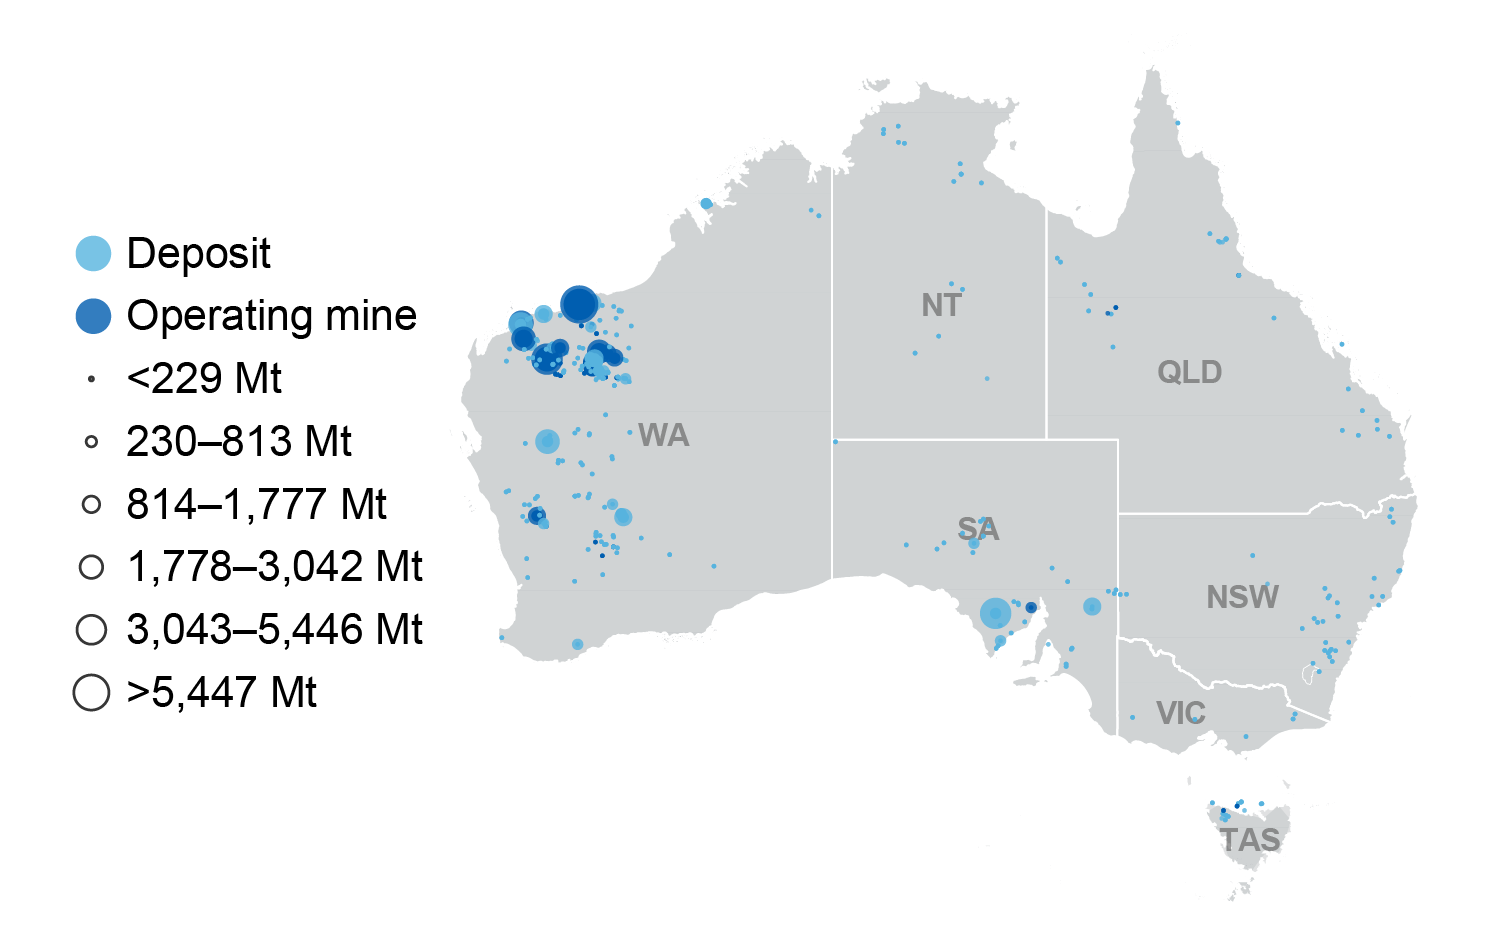
Major iron ore deposits

Map of Australia showing that most iron ore deposits and operating mines are located in Western Australia

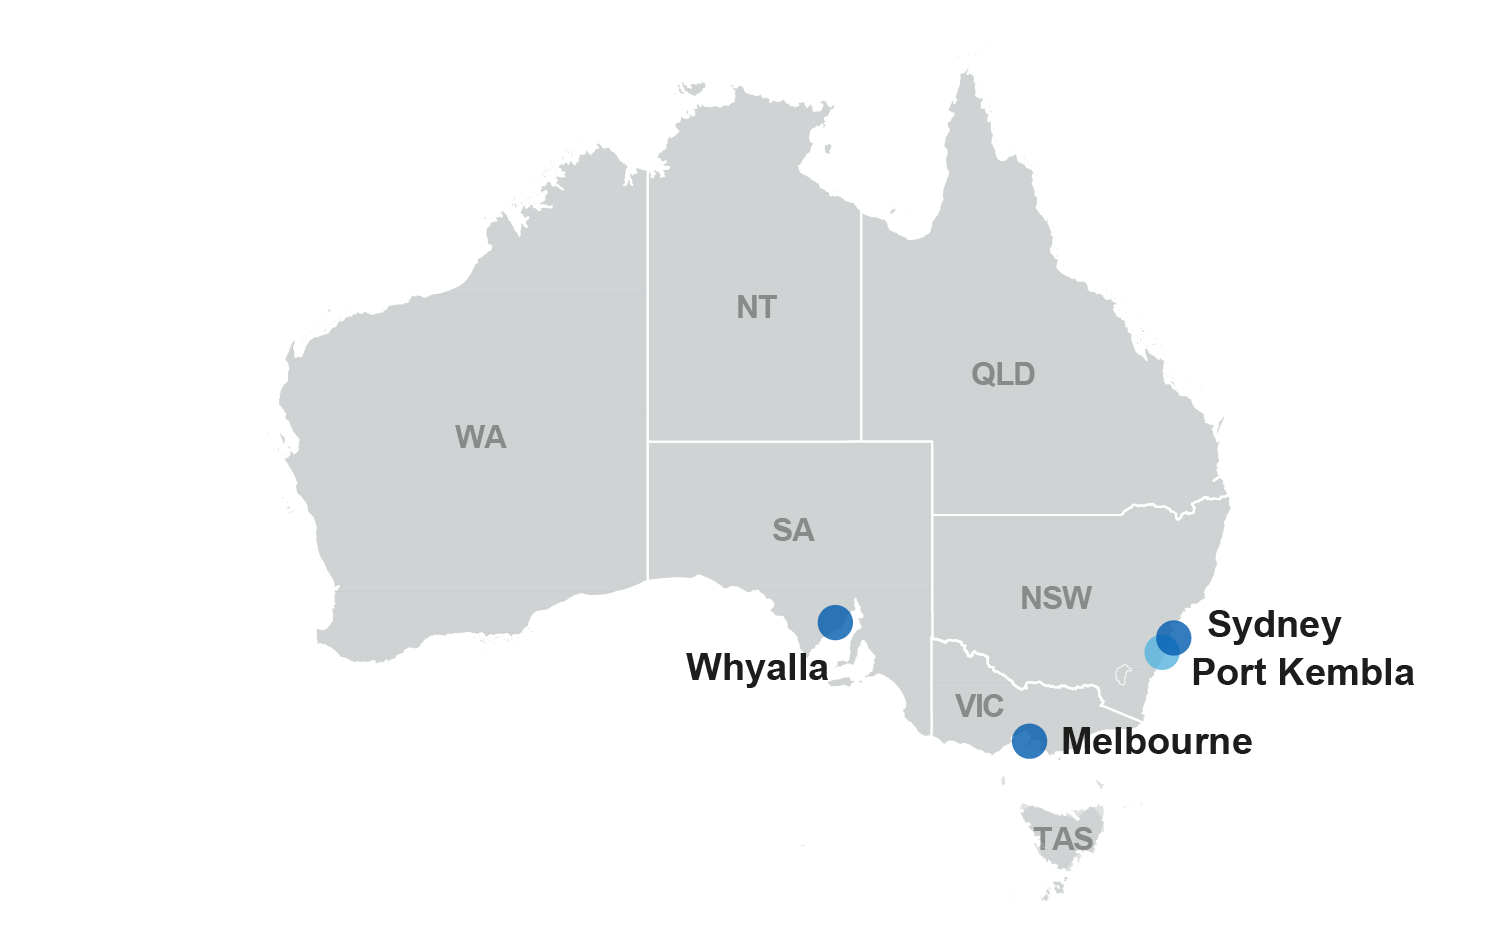
Australian steel refineries

Map showing Australia's 4 steel mills. They are in Port Kembla, New South Wales; Sydney, New South Wales; Whyalla, South Australia and Melbourne, Victoria.

Metallurgical coal

Latest developments

Seaborne metallurgical coal demand is expected to remain soft over the rest of 2024 before improving from 2025. Weak steel production (because of poor demand from China’s property sector) will be counteracted slightly by increased demand from India’s steel industry. Australian supply may be affected by a potential recurrence of a La Niña weather cycle. 

  • Metallurgical coal prices have declined in recent months. Chinese demand has decreased because of low profitability in Chinese steel production. The benchmark price is expected to fall from US$251 a tonne in 2024 to US$205 a tonne by 2026.
  • Falling prices are forecast to reduce export earnings from $54 billion in 2023–24 to $42 billion in 2025–26.
  • Export volumes are expected to rise from 151 Mt in 2023–24 to 175 Mt by 2025–26 (see Australia section). A potential recurrence of the La Niña cycle has been factored into volumes in 2024–25.

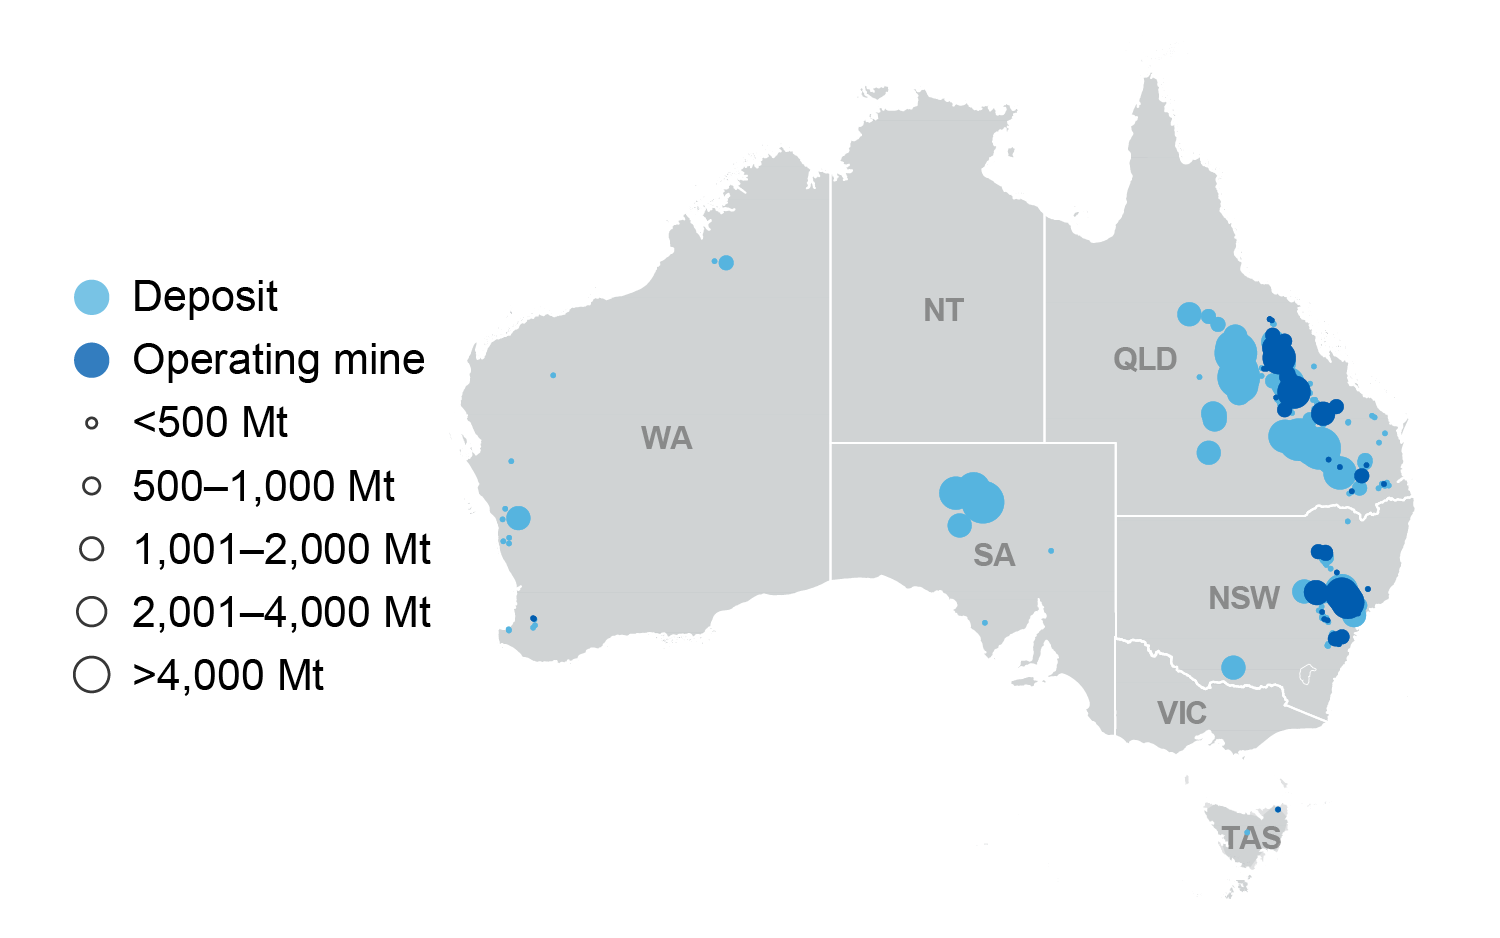
Major coal deposits

Map of major Australian coal deposits and mines. Most coal deposits are in Queensland and most operating mines are in New South Wales.

Thermal coal

Latest developments

Thermal coal markets have been tight in recent months. Demand from China is higher than expected, secondary sanctions against Russia are reducing supply, and hot weather across several Asian markets has boosted power demand.

  • Australia’s thermal coal export earnings are expected to ease from $37 billion in 2023–24 to around $29 billion by 2025–26 as prices fall.
  • Thermal coal spot prices are expected to gradually decline over the outlook period, from US$135 a tonne in 2024 to US$113 a tonne by 2026. Contract prices are expected to fall from around US$200 a tonne (in Japanese financial year 2023–24) to US$123 a tonne.
  • Export volumes are expected to drop to 198 Mt in 2024-25, reflecting the impact of likely weather disruptions, before rising to 205 Mt in 2025-26. A potential recurrence of the La Niña cycle presents a risk to supply.

Major coal deposits

Map of major Australian coal deposits and mines. Most coal deposits are in Queensland and most operating mines are in New South Wales.

Gas

Latest developments

Gas markets have stabilised over the past few quarters, but 13 consecutive months of record global average temperatures have pushed up Asian LNG demand, increasing prices. 

  • Australia’s LNG export revenues are forecast to decline from $69 billion in 2023–24 to $60 billion by 2025–26.
  • The fall in export earnings is likely to be driven by lower LNG prices, which have declined from the record levels of 2022. Depletion of some gas reserves could marginally affect export volumes.
  • New supply from the US and Qatar should help to bring LNG prices down further towards the end of the outlook period. Prices are expected to remain below US$12/MMBtu over the next 2 years.

LNG projects and gas basins

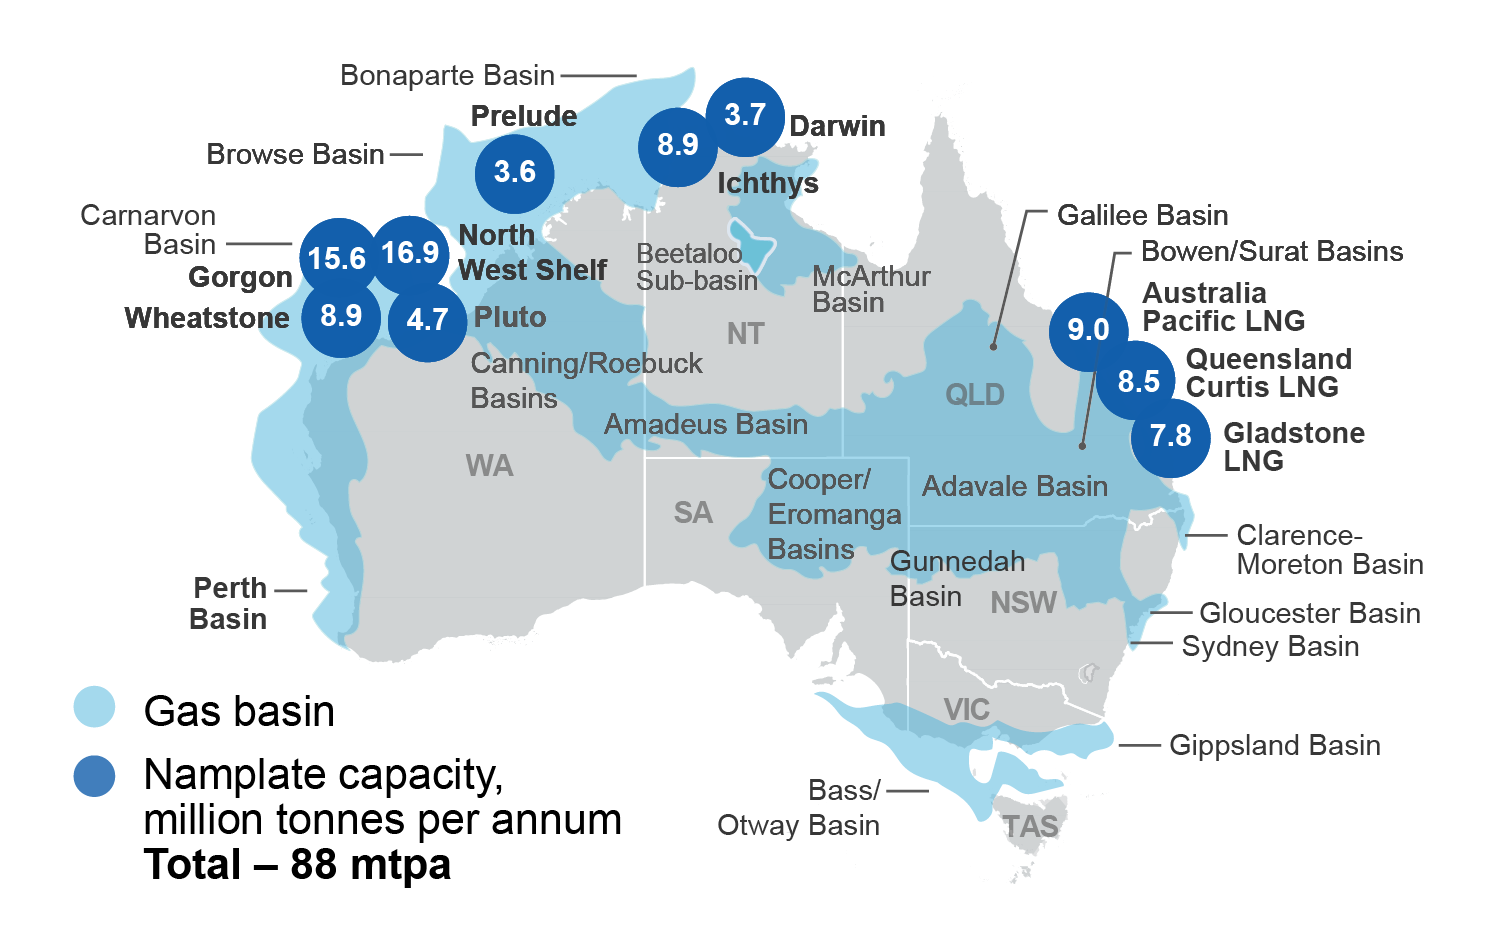
Map of Australia showing that LNG projects are located in Queensland, the Northern Territory and Western Australia. Their combined nameplate capacity is 88 million tonnes per year

Oil

Latest developments

Crude oil prices have fallen as regional geopolitical risk is priced out and strong supply puts downward pressure on prices. Over the outlook period, export revenues are expected to fall as prices and output fall.

  • The Brent crude oil price is forecast to fall from an average US$83 a barrel in 2023 to US$69 a barrel in 2026. The fall is expected will be driven by weak demand and gains in ex-OPEC production.
  • Australia’s crude and condensate output is forecast to fall steadily over the outlook period, from 253,000 barrels a day in 2024–25 to about 231,000 barrels per day by 2025-26, as mature fields see diminishing output.
  • Australia’s crude and condensate export earnings are forecast to fall from A$12.6 billion in 2023–24 to A$8.7 billion by 2025–26, as prices fall and output declines. 

Crude oil, condensate and LPG resources

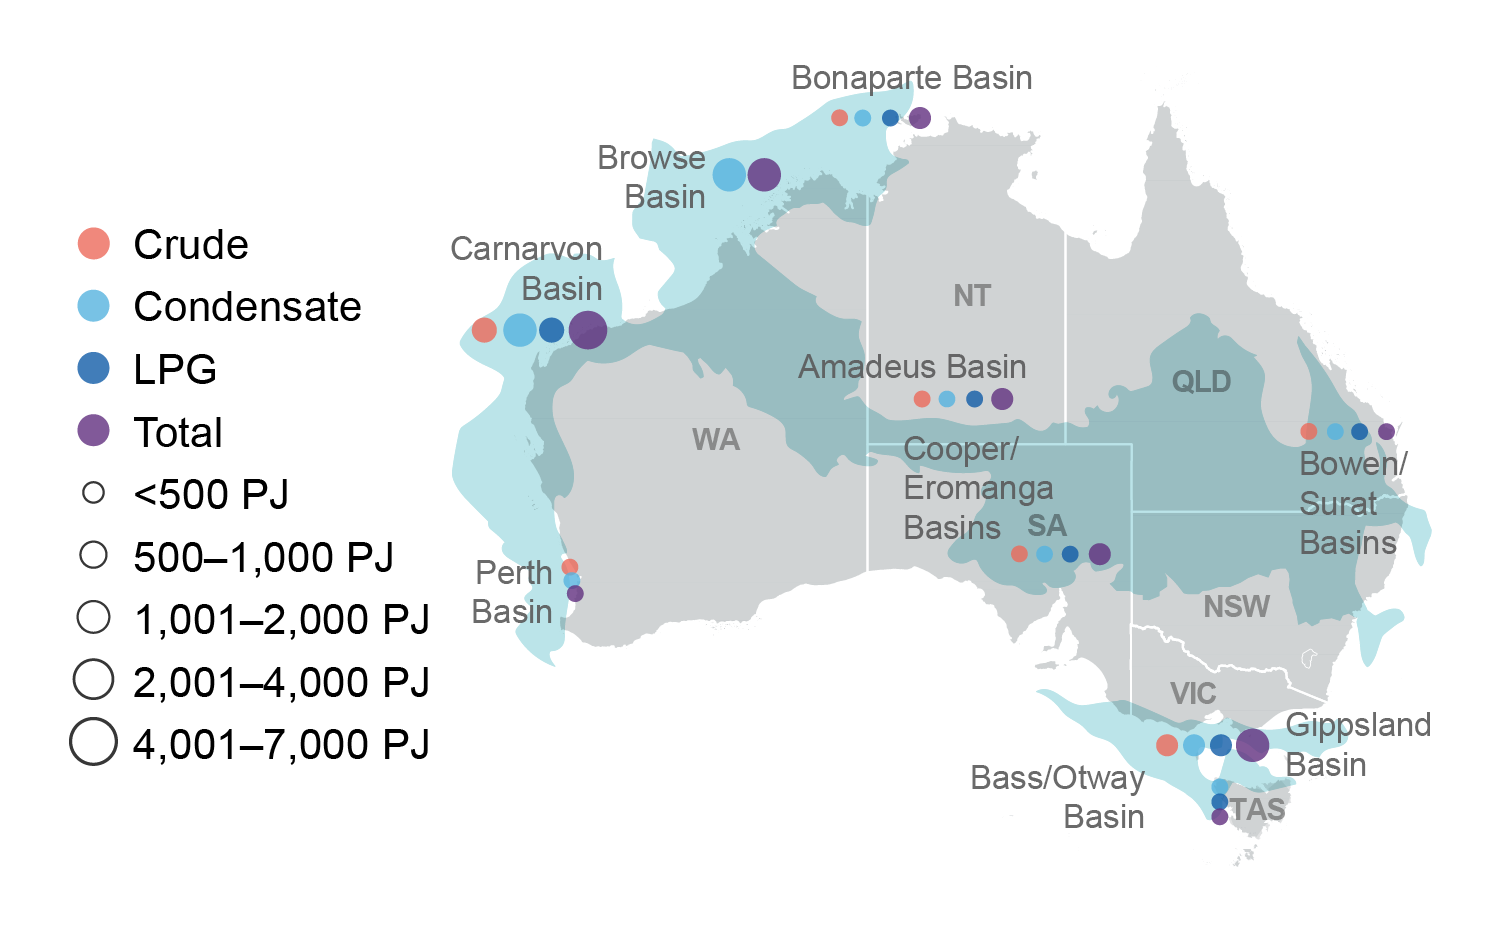
Map of Australia showing that around three-quarters of Australia's oil production comes from the Carnarvon Basin offshore Western Australia

Lithium

Latest developments

Persistent weakness in global electric vehicle (EV) sales weakens the outlook for lithium export earnings.

  • Australia’s lithium export earnings are forecast to fall from $9.9 billion in 2023–24 to $6.3 billion in 2024–25 before rising to $8.2 billion in 2025–26. The fall will be driven by a weaker lithium price, partially offset by a 55% increase in Australia’s lithium mine production over the outlook period.
  • Global lithium demand is forecast to rise by 17% a year between 2023 and 2026, driven by rising EV adoption. However, EV adoption is rising slower than expected as sales remain weak in the US and EU markets.
  • The market surplus is expected to narrow following the suspension of some production, including a major Chinese lepidolite mine in September 2024. Australia is forecast to add more lithium supply than any other country between 2023 and 2026, but substantial supply is also expected from Argentina, China and Zimbabwe.

Major lithium deposits and mines

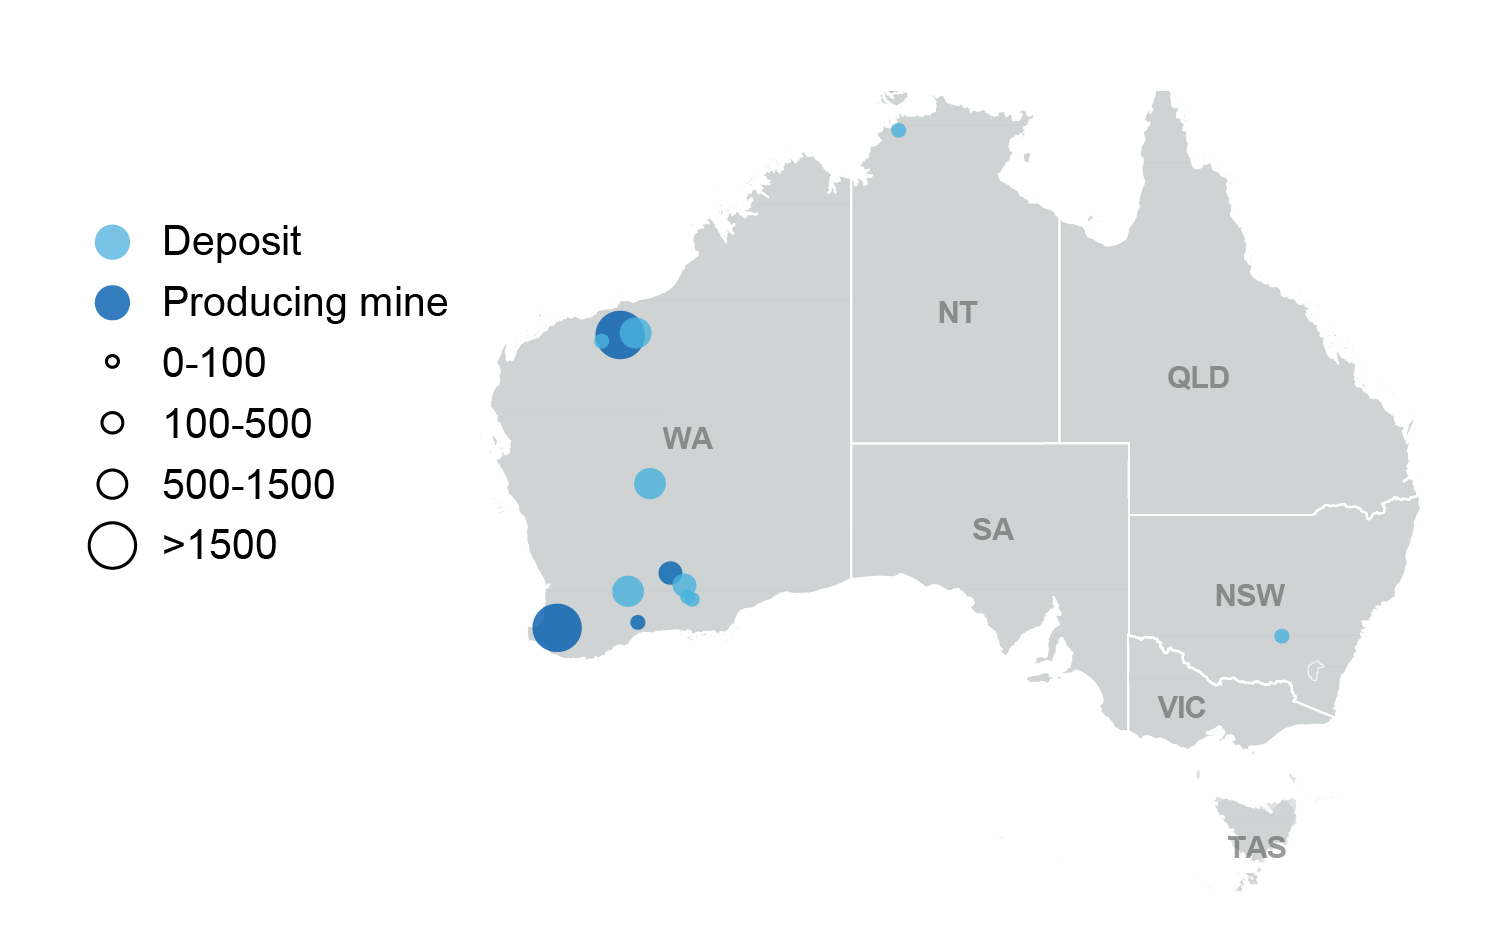
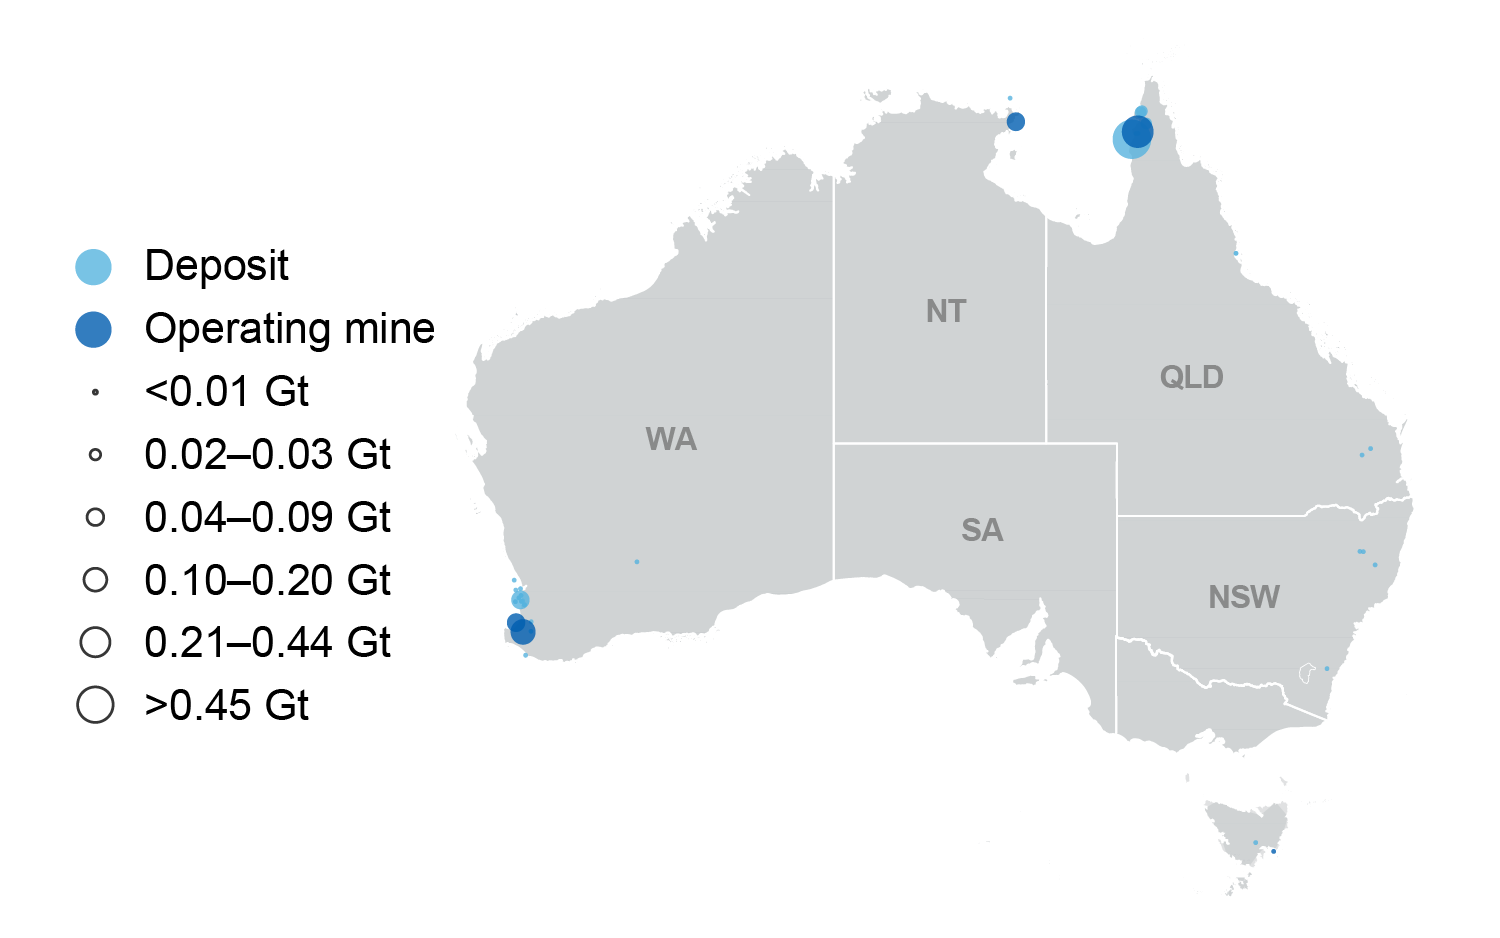
Map of Australia showing that all producing lithium mines and almost all deposits are located in Western Australia

Uranium

Latest developments

Uranium export earnings have been revised down slightly from the June 2024 Resources and Energy Quarterly as prices have cooled from the highs of early 2024. Prices are expected to rise slowly through the outlook period as a market shortfall persists.

  • Nuclear power is undergoing a renaissance in many countries, as fossil fuels are phased out to meet net zero climate targets.
  • Prices have recently settled in a US$80-90 a pound range after declining from a peak above US$100 a pound in early 2024. Price pressures are expected to persist until 2026, with the price likely reaching almost US$90 a pound by the end of 2026.
  • Price and volume growth are projected to lift Australian export values from A$1.3 billion in 2024–25 to A$1.5 billion by 2025–26.

Major uranium deposits

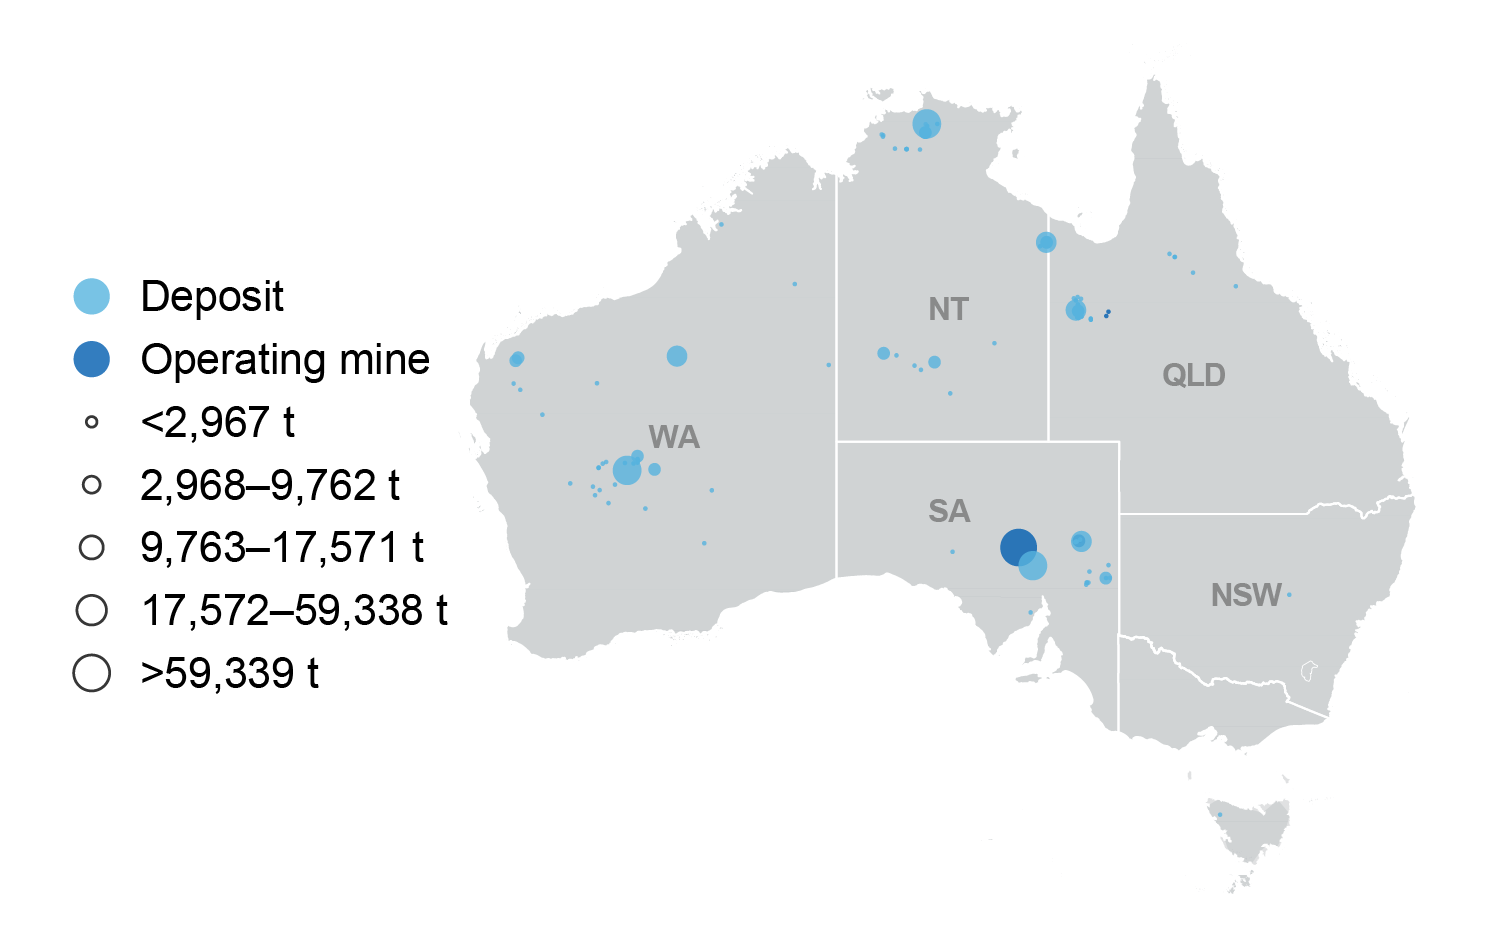
Map of Australia showing uranium deposits and operating mines

Gold

Latest developments

Australian gold export earnings have been revised up sharply from the June 2024 Resources and Energy Quarterly, because of new record prices. 

  • Gold prices have increased by 30% since the start of 2024. The increase is a result of continued and increasing geopolitical uncertainty, coupled with easing in global monetary conditions. Prices are forecast to remain elevated throughout the forecast period. 
  • In the June quarter 2024, Australian gold production decreased by 6.0% year-on-year because of lower grades and weather-related disruptions. Yearly gold production is forecast to fall slightly in 2024 before resuming growth in 2025 as new projects and expansions come online.
  • Australia’s gold exports were a record $32.9 billion in 2023–24. Higher prices should lift earnings to $34.8 billion in 2024–25. Higher export volumes and prices should then lift earnings to $35 billion in 2025–26.

Major gold deposits

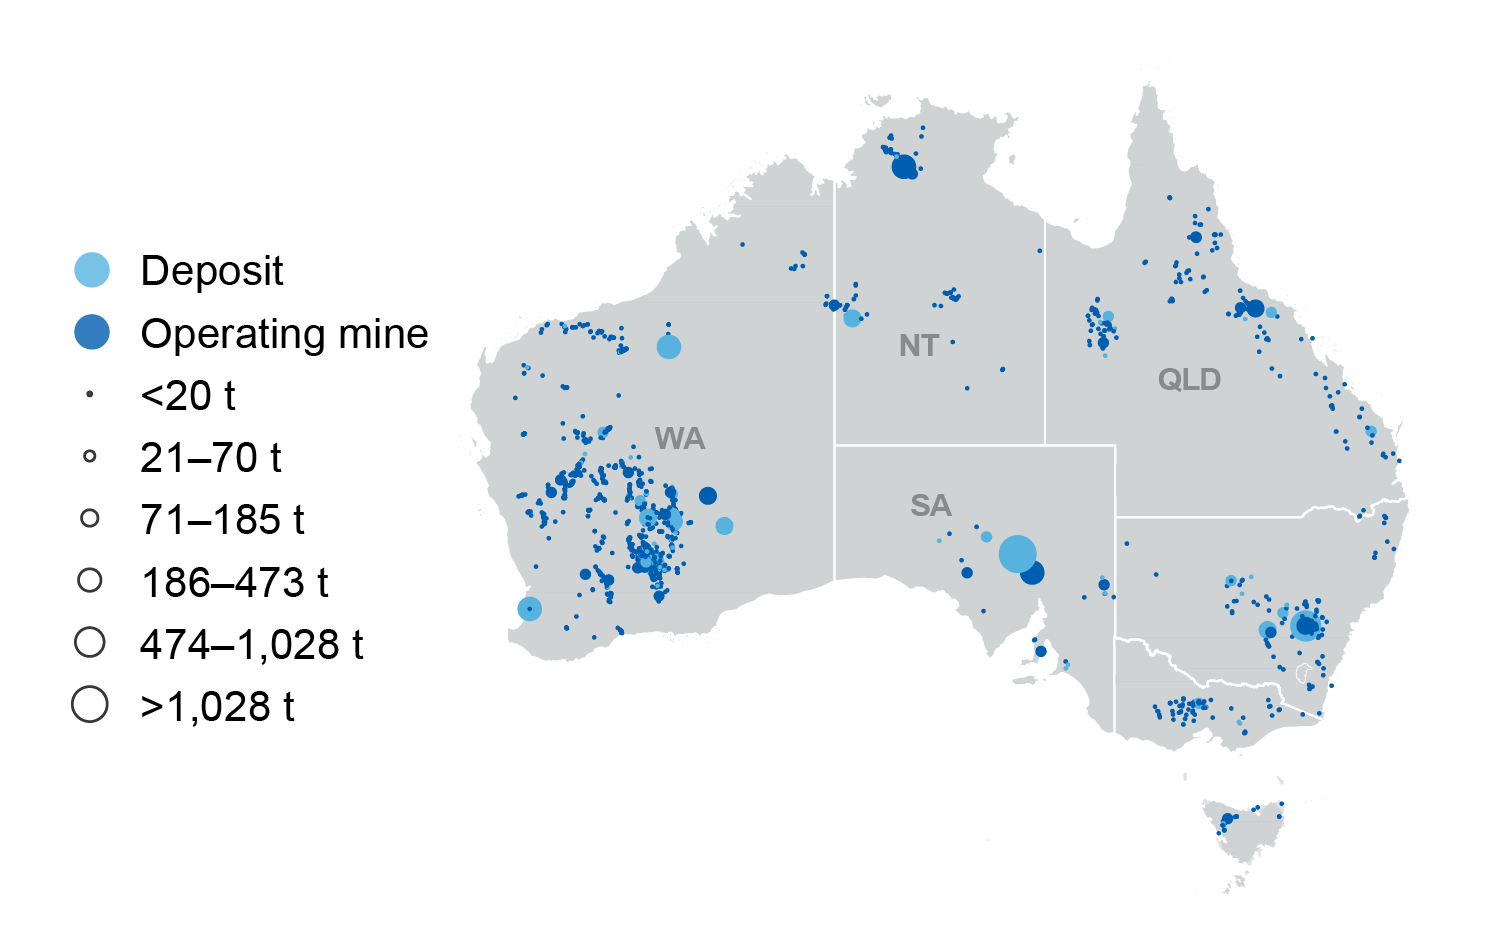
Map of Australia showing that most major gold deposits are in Western Australia

Aluminium, alumina and bauxite

Latest developments

Export earnings for 2024–25 have been revised up from the June quarter 2024. Primary aluminium prices are expected to rise through to 2026, with growing demand for new energy-efficient cars and technologies.

  • The aluminium price has increased by 8.8% so far in 2024. The price is expected to rise further over the outlook period, driven by monetary policy easing in the West and rising global demand from electric vehicles (EV) and energy efficient technologies.
  • Stable Australian primary aluminium output (at 1.6 million tonnes a year), lower Australian alumina output (at 19 Mt a year) and higher Australian bauxite output (over 100 million tonnes a year) are expected over the outlook period.
  • Higher aluminium prices and production ramp-ups at existing bauxite operations are likely to increase Australia’s aluminium, alumina and bauxite exports to $19 billion in 2024–25.

Major bauxite deposits

Map of Australia showing the locations of bauxite deposits and mines

Copper

Latest developments

From an average of US$9,750 a tonne in the June quarter, refined copper prices averaged US$1,000 a tonne less in August 2024 because of rising inventories, a weak Chinese property sector and slower US economic growth.

  • Global copper consumption is forecast to grow by 2.5% and 3.2% in 2025 and 2026 respectively. Growth will primarily be driven by manufacturing, the energy transition and construction in the US, China and India.
  • Copper prices are forecast to average US$9,370 a tonne in 2024, rising to US$9,766 a tonne in 2026.
  • Australian copper export earnings are forecast to reach around $15.4 billion in 2024–25. Growth in production and exports will then see export earnings reach $15.6 billion in 2025–26.

Major copper deposits

Map of Australia showing copper deposits are located in all states

Nickel

Latest developments

Australia’s nickel export earnings continue to be impacted by falling nickel prices and production cuts.

  • Nickel prices fell to US$16,600/t in the September quarter, as Indonesian supply growth outweighed production cuts in the rest of the world. New Indonesian supply growth and downside demand risks limit meaningful price increases over the forecast period.
  • World demand for nickel remained robust in the June quarter 2024, however weakness in stainless steel production and EV sales may slow demand growth over the rest of the year.
  • Weaker prices and reduced production from major mine closures are expected to see Australian nickel export earnings fall by over half to $1.4 billion in 2024–25, declining further to $1.0 billion in 2025–26.

Major nickel deposits

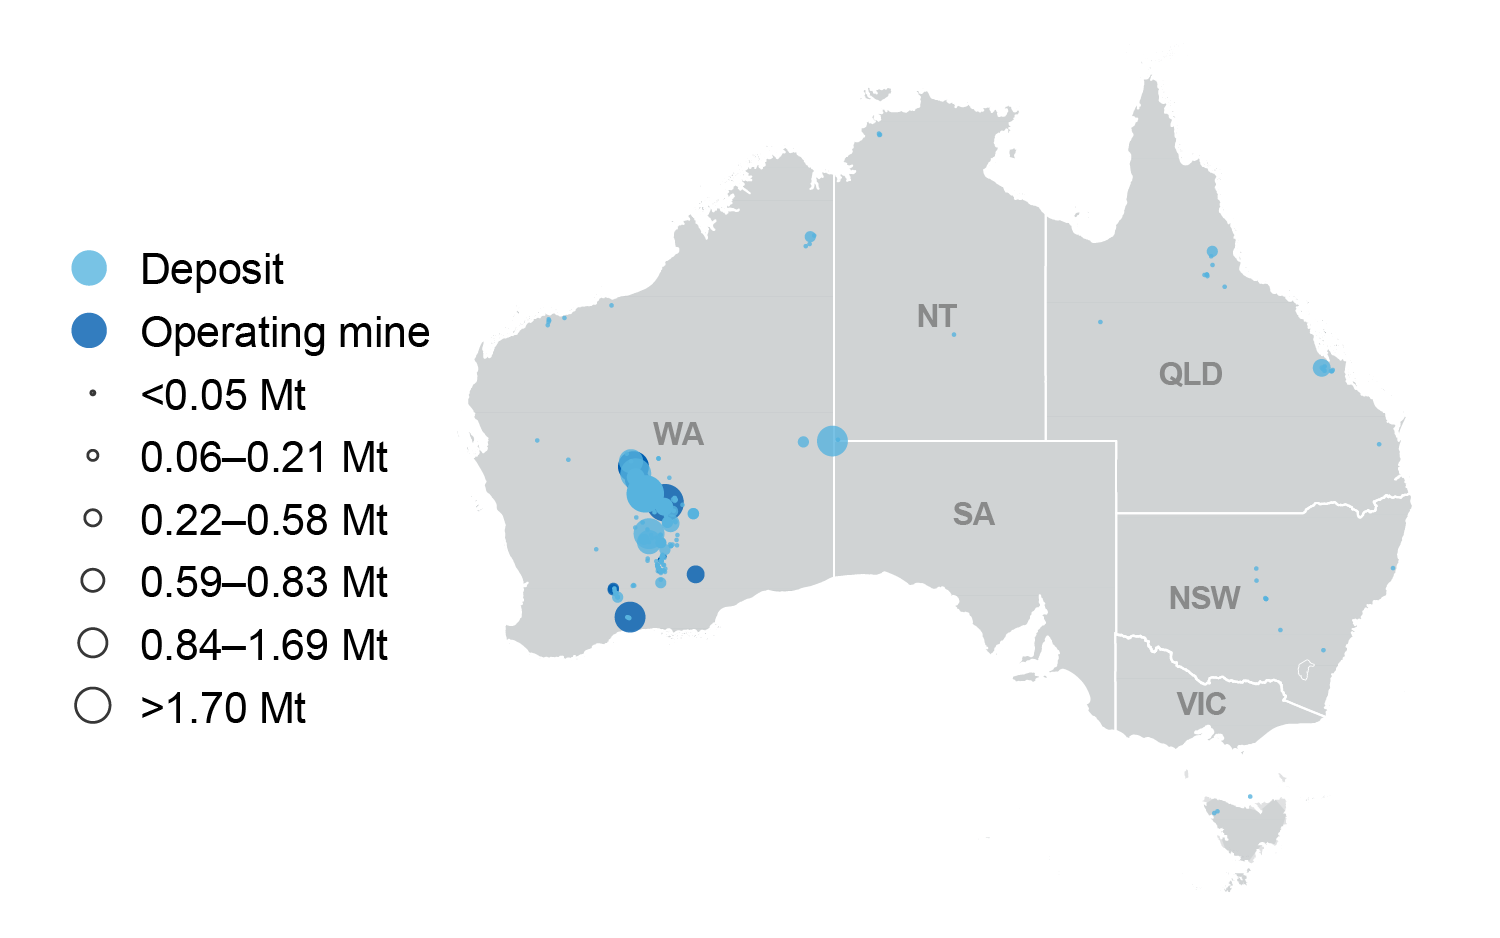
Map of Australia showing most nickel deposits and all operating mines are located in Western Australa

Zinc

Latest developments

Export earnings for 2024-25 and 2025-26 have been revised down from the June 2024 quarter because of a downward revision in export volumes and a modest reduction in the forecast zinc price.

  • Zinc demand continues to strengthen. After large falls in 2023, the zinc price is forecast to steady over the outlook period, increasing from about US$2,720 a tonne in 2024 to about US$2,770 a tonne in 2025, before dipping back to around US$2,710 a tonne in 2026.
  • Australia’s zinc mine production is expected to ease over the outlook period, as production tapers off in some of Australia’s older zinc mines. However, Australia’s refined output is expected to increase.
  • Australia’s zinc exports are forecast to increase from $3.8 billion in 2023–24 to $3.9 billion in 2024–25 before easing to $3.7 billion in 2025–26.

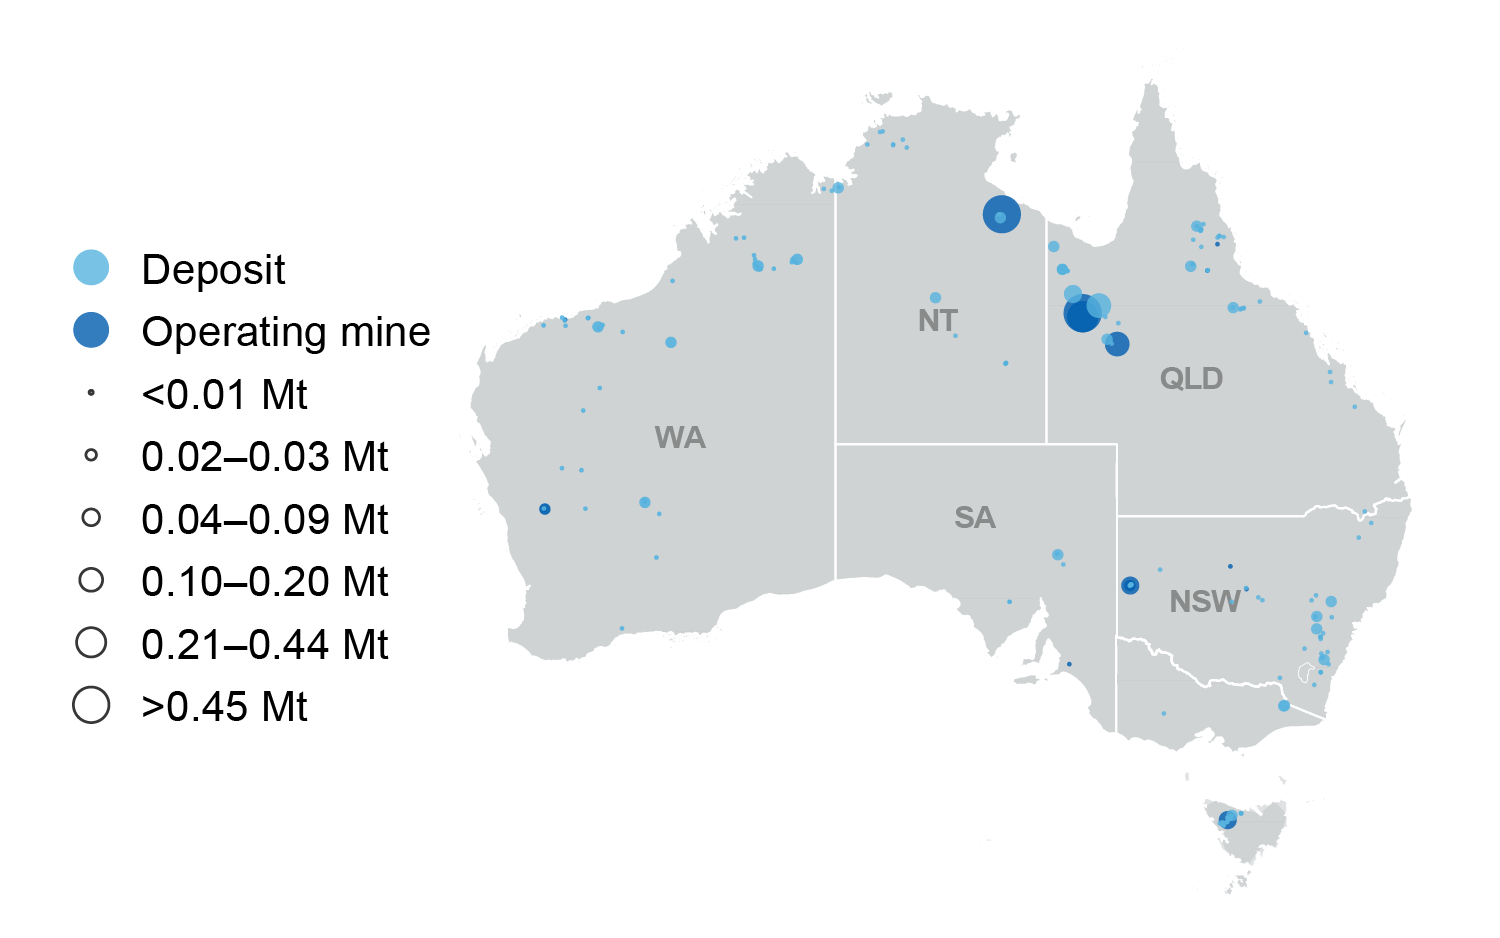
Major zinc deposits

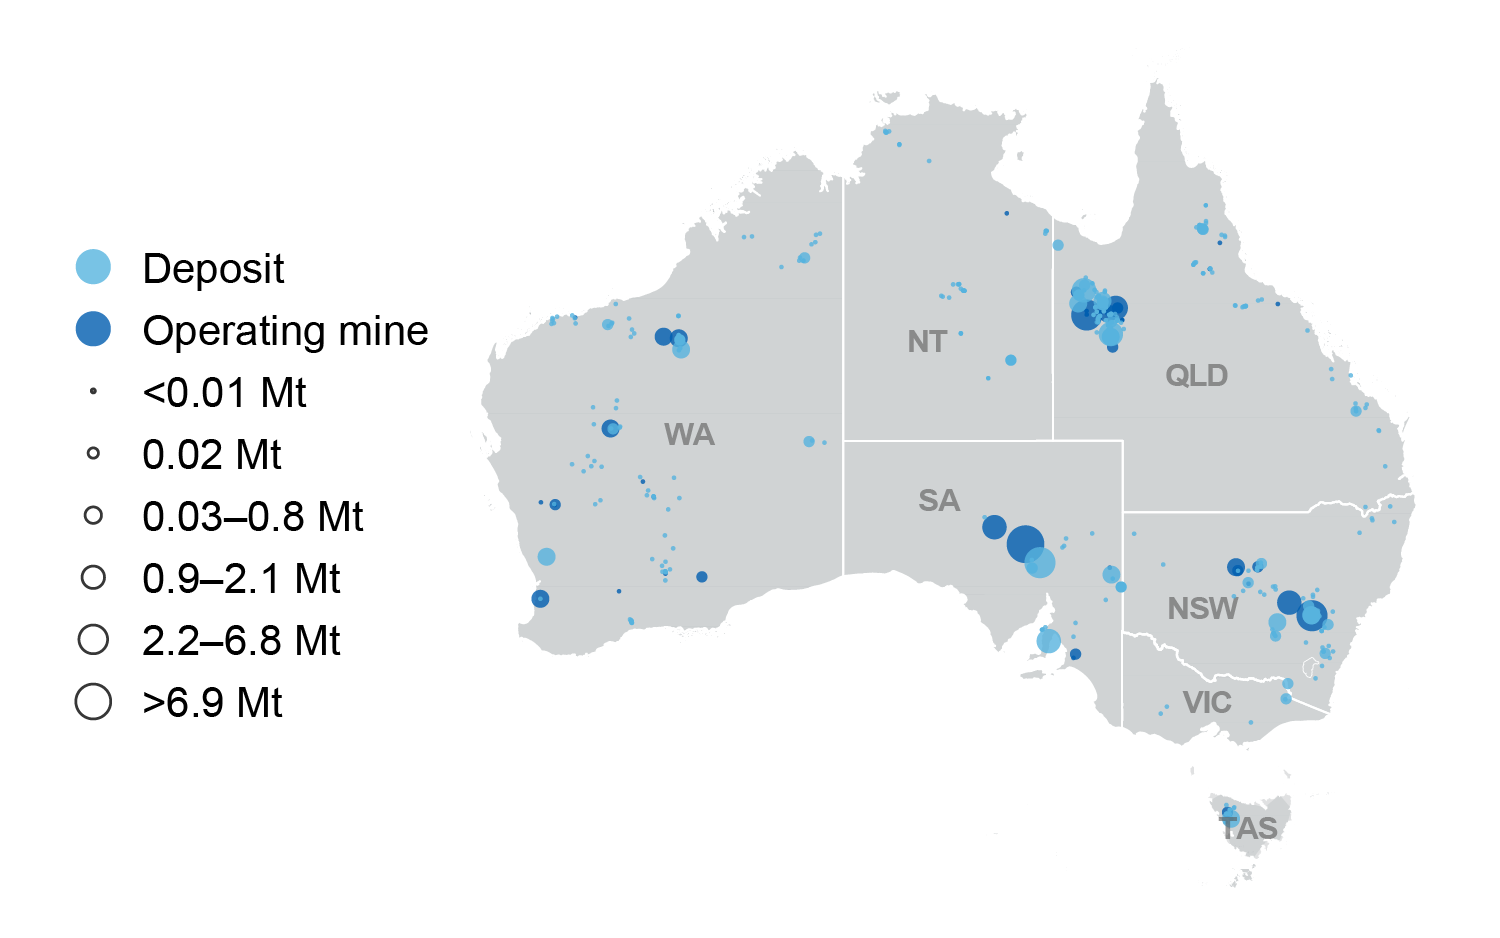
Map of Australia showing zinc deposits in all states. The largest operating mines are in Queensland and the Northern Territory