Resources and energy quarterly: September 2023

Date published:
3 October 2023

Introduction

The Resources and energy quarterly (REQ) contains the Office of the Chief Economist’s forecasts for the value, volume and price of Australia’s major resources and energy commodity exports.

The publication provides:

  • a 2-year outlook for global commodity prices, demand and supply
  • up-to-date global production and consumption data
  • forecasts for the production values, export values, volumes and prices of key Australian resources and energy commodities
  • reviews of relevant topics and issues, such as the outlook for China and the value of the battery supply chain
  • detailed statistical tables
  • interactive data using Power BI.

This edition also includes a special chapter on the battery value chain to complement our analysis of Australia’s lithium sector.

Explore the interactive data dashboards

Use Power BI to build your own charts and tables.

Overview

Latest developments

Australia’s resource and energy export earnings are forecast to decline from the record $467 billion in 2022–23.

  • Resource and energy commodity prices fell further in the September quarter 2023, driven by supply and demand factors mostly pushing in the same direction. However, supply cuts by some major oil producers are helping stabilise oil prices. Consumers replenishing from already low inventories is also helping support the price of oil and other commodities.
  • After a record $467 billion of export earnings in 2022–23, weaker world demand and improving world commodity supplies are expected to reduce Australia’s earnings to $400 billion in 2023–24, with another significant fall likely in 2024–25.
  • There are rising concerns about economic growth in China. Despite the end of COVID lockdowns, structural and cyclical factors are causing China’s growth to remain relatively weak. This has implications for world commodity markets and Australia as a major supplier of commodities and services to China. 

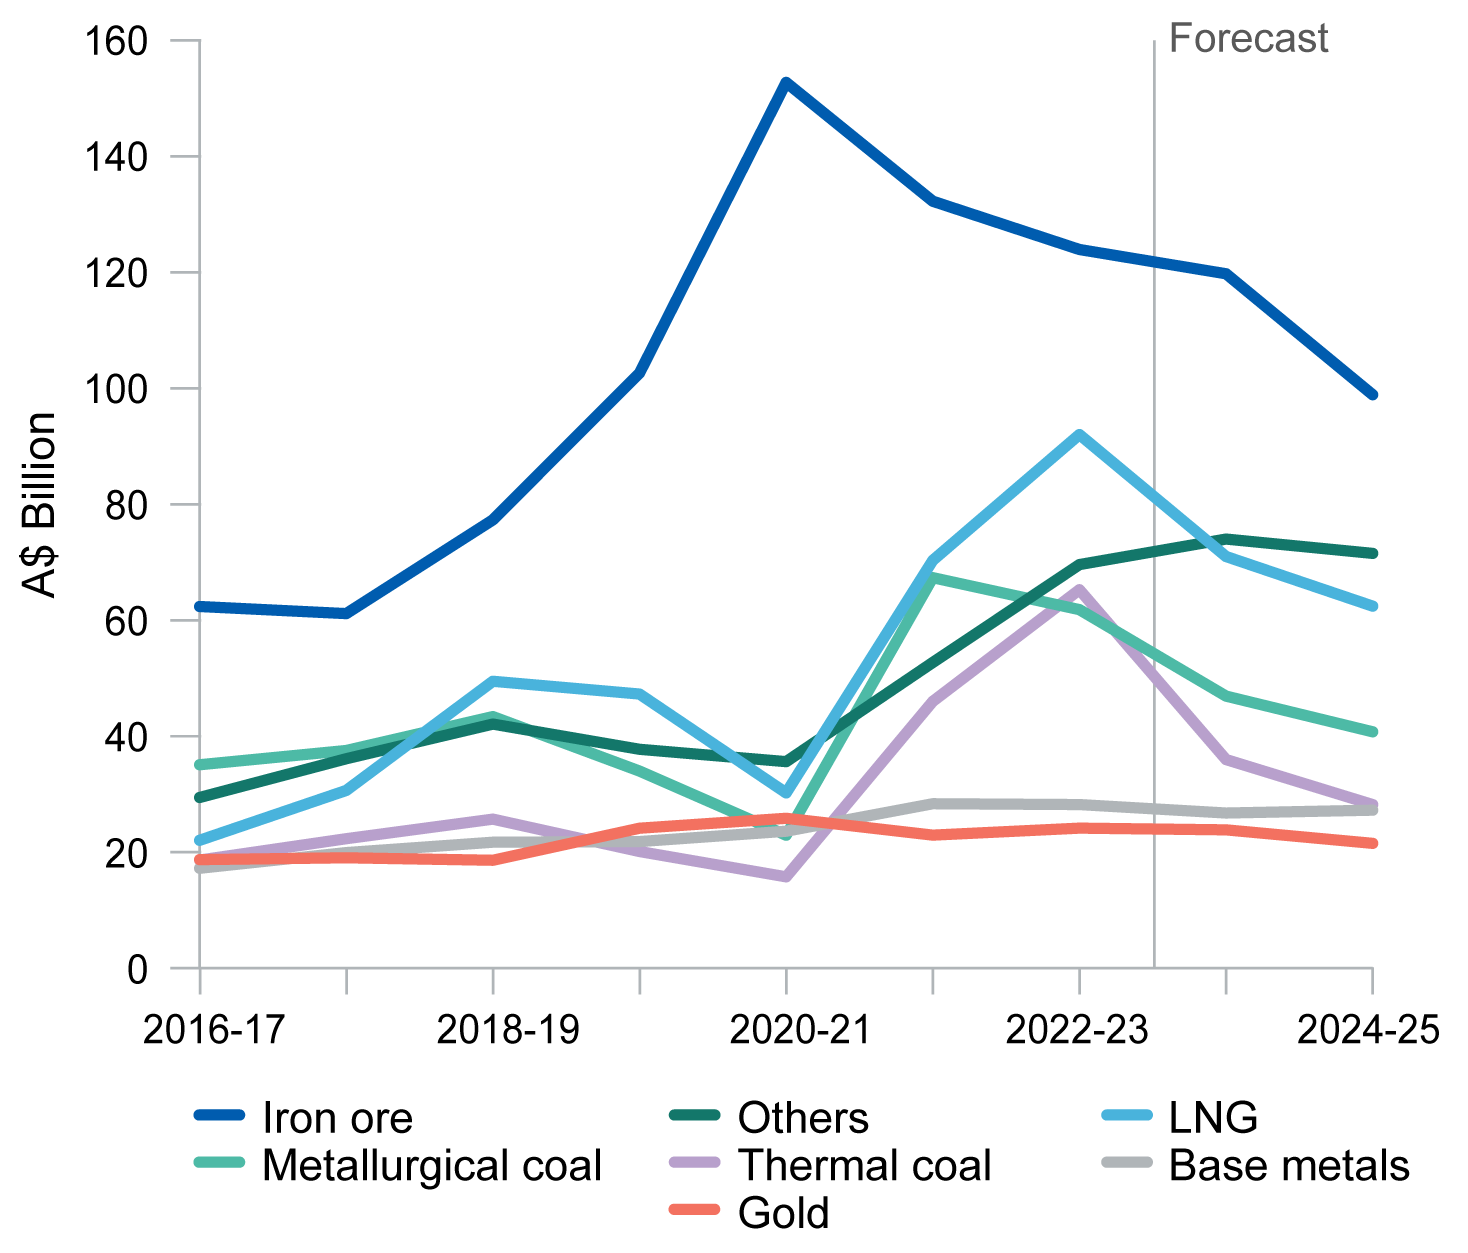
Australia's resource and energy exports by year

This chart shows Australia’s annual export values for major resource and energy commodities for the period 2007–08 to 2024–25

This chart shows Australia’s annual resource and energy export values (in A$ billions) for each major resources and energy commodity from 2007–08 to 2024–25. 

The chart shows the 2 waves of resource and energy export earnings that Australia has experienced since the COVID-19 pandemic. The first wave occurred in 2021, as iron ore prices pushed to record highs following China's reopening. The second wave of revenues came from the spectacular surge in energy prices in 2022, which originated from the fallout over Russia's invasion of Ukraine. Higher energy prices lead to record high earnings for coal and LNG.

Macroeconomic outlook

Latest developments

The IMF’s core outlook for the global economy has improved since the June report. However, slowing growth in the Chinese economy – due in large part to ongoing issues with the nation’s property sector – has tilted the balance of risks towards the downside.

  • The balance of risks surrounding the global macroeconomic outlook have deteriorated slightly since the June 2023 Resources and energy quarterly. While the IMF’s core outlook for global growth has improved, there is a mounting risk China’s growth could be weaker than expected.
  • Tighter fiscal and monetary conditions in most major economies are expected to slow global economic growth over the second half of 2023 and into 2024.
  • Slowing growth in the Chinese economy is due to a combination of cyclical and structural factors. Box 2.1 in the report explores 3 key structural challenges to China’s growth outlook.

Contribution of major economies to global GDP, 2022

This chart shows the annual share of global GDP for major economies, as well as the annual change and Australia's share of two-way trade. China is the largest national economy in purchasing power parity terms and holds a 30% share of Australia's two-way trade. Data table follows
Country Share of global GDP Yearly change Share of trade with Australia
China 18% +3.0% 30%
US 16% +2.1% 6%
EU 15% +3.7% 9%
India 7% +7.2% 4%
ASEAN 5% +5.3% 10%
Japan 4% +1.0% 12%
South Korea 2% +2.6% 7%
Taiwan 1% +2.5% 4%
Australia 1% +3.7% Not applicable

Steel

Latest developments

As in the June report, global steel production faces a weaker second half of 2023. This is due to lower demand from China’s property sector and slowing manufacturing and construction in advanced economies. The outlook in 2024 is expected to strengthen on the back of rising ex-China demand, particularly from India and South-East Asia.

  • Global steel demand has continued to slow. This is driven by China’s ongoing property sector weakness, as well as lower demand from European manufacturing and construction. 
  • Global steel producers are expected to face subdued demand and moderating prices over the rest of 2023. Weak residential construction and falling industrial output in advanced nations is likely to be only partly offset by growth in infrastructure and non-residential construction activity.
  • Many steel producers have already cut back production, and global production is expected to remain relatively subdued through 2023 and into 2024. Steel production growth is expected to be strongest in India, South-East Asia and the Middle East.  

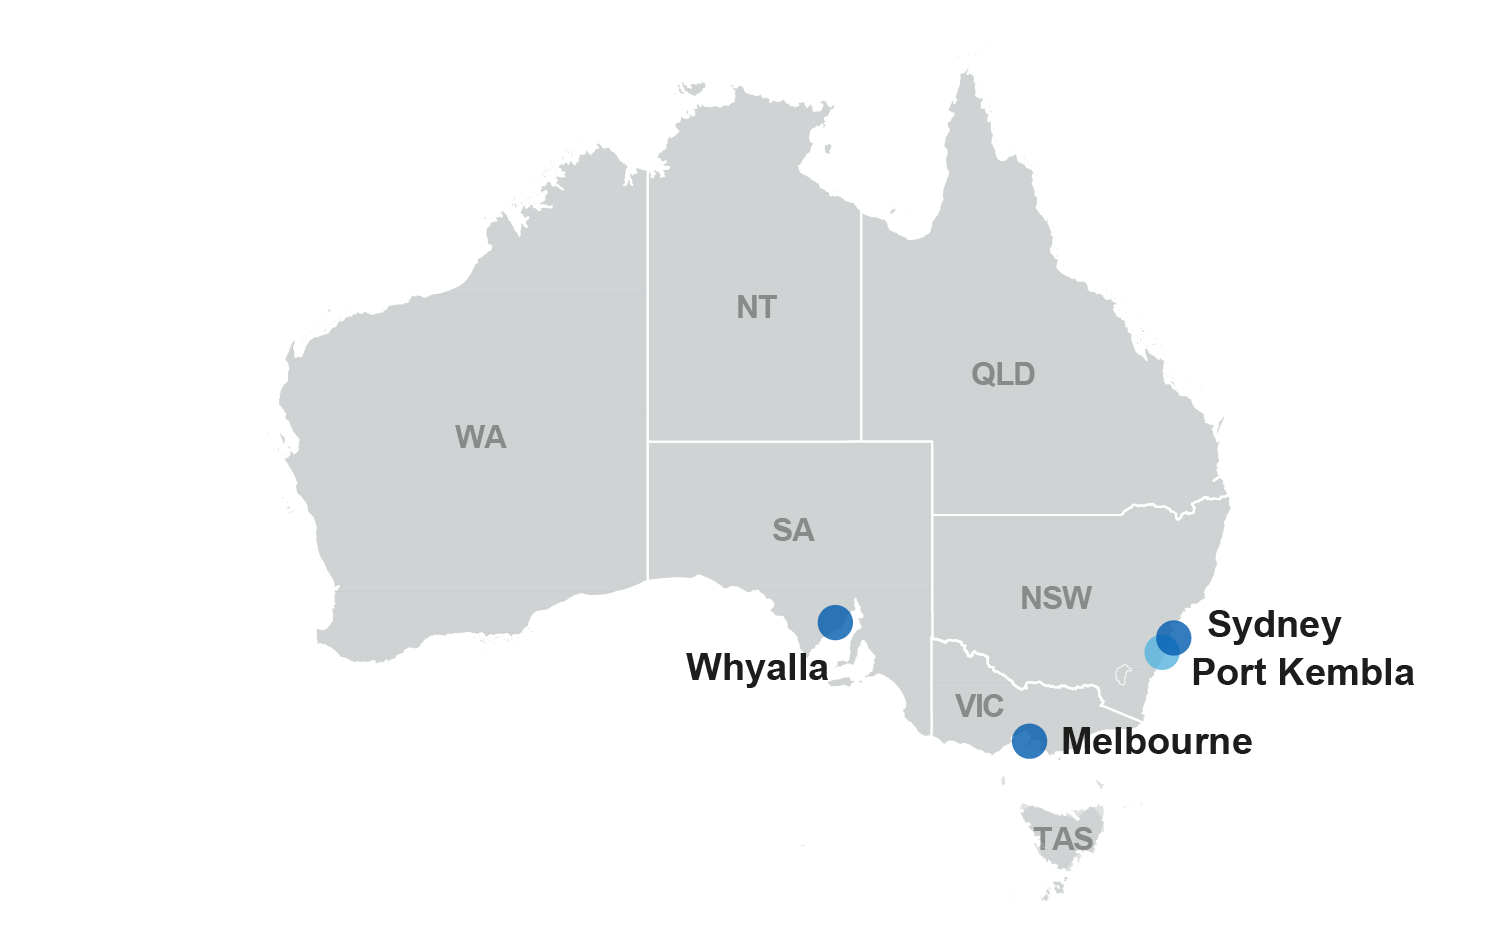
Australian steel refineries

Map showing Australia's 4 steel mills. They are in Port Kembla, New South Wales; Sydney, New South Wales; Whyalla, South Australia and Melbourne, Victoria.

Iron ore

Latest developments

Revenue expectations have increased slightly from June due to a weaker exchange rate and slightly stronger export volumes and prices. Iron ore prices have been volatile, but the price outlook is for further weakening as optimism fades for China’s property recovery and global supply continues to rise.

  • Spot iron ore prices have been volatile in the September quarter. But they have generally moderated since the start of the year, driven by slowing global economic growth and China’s property sector weakness.
  • Australian export volumes remain strong, with further greenfield supply from established and emerging producers expected to come online in the next few years.
  • Australia's iron ore export earnings are expected to decline from $124 billion in 2022–23 to $120 billion in 2023–24 and $99 billion in 2024–25. This is driven by lower prices over the outlook period.

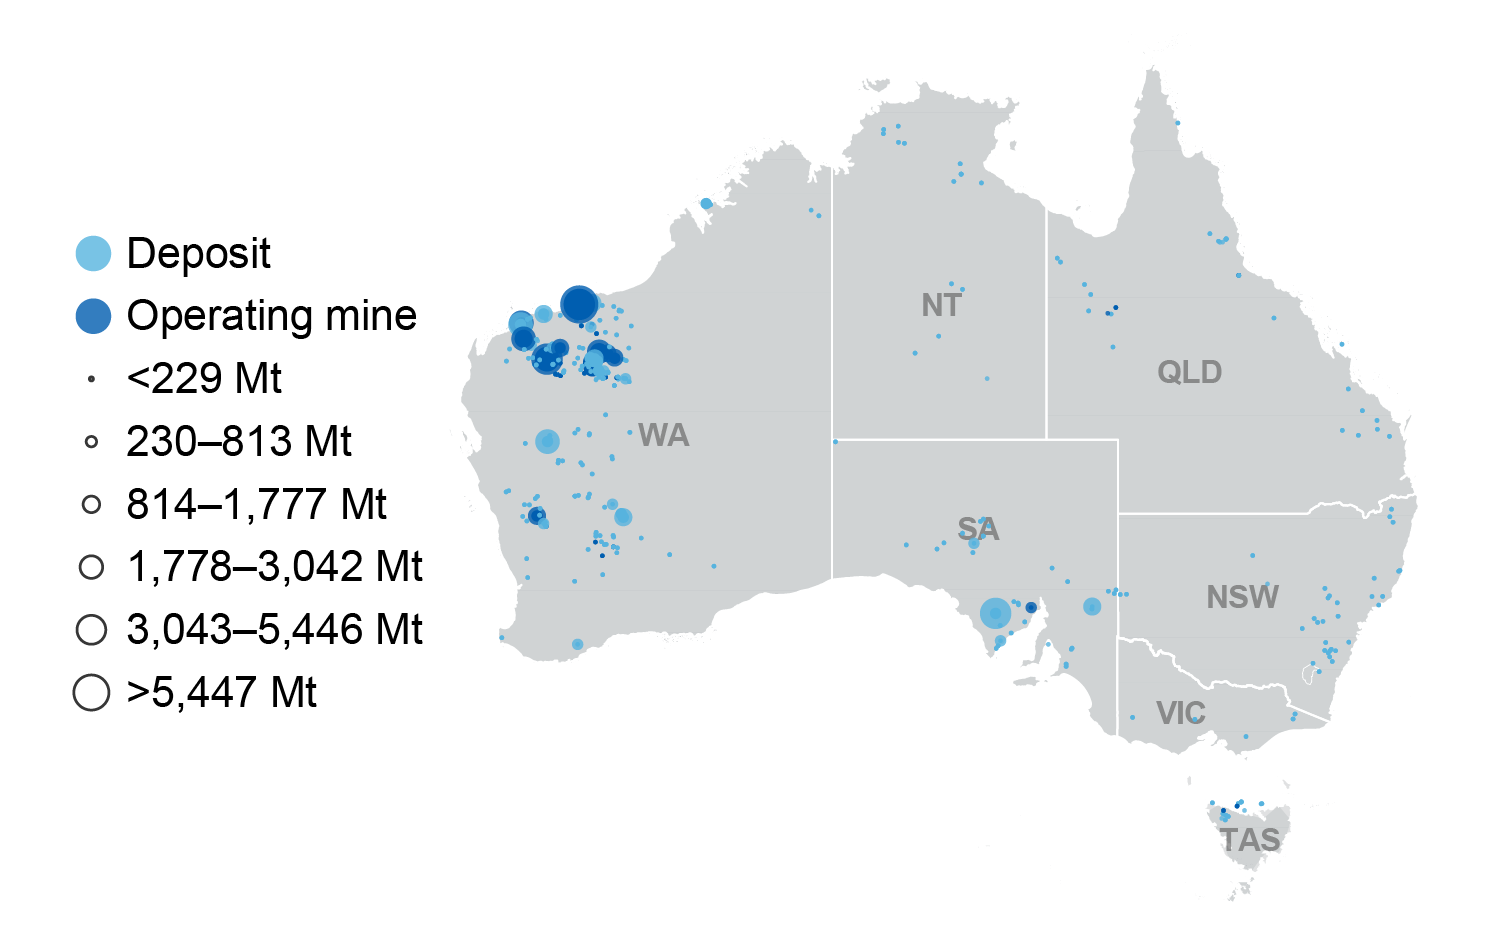
Major iron ore deposits

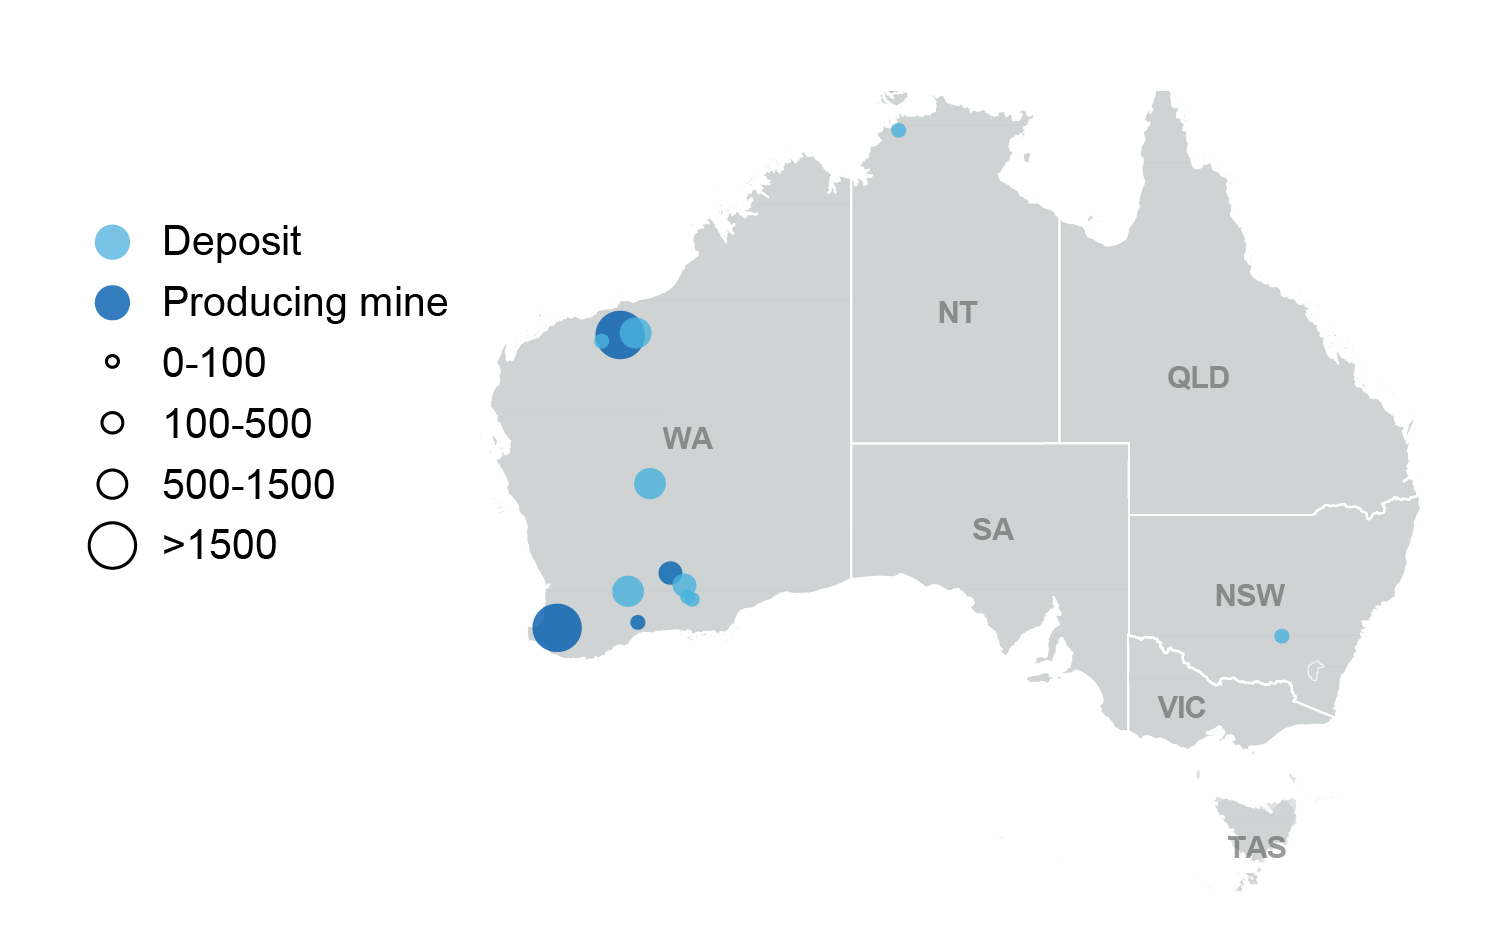
Map of Australia showing that most iron ore deposits and operating mines are located in Western Australia

Metallurgical coal

Latest developments

Metallurgical coal export earnings are expected to edge down in line with global steelmaking.

  • Metallurgical coal prices remain well above their pre-2019 level, with prices holding up despite a softening global economic outlook. The Australian premium hard coking coal price is expected to average US$265 a tonne in 2023, falling to around US$200 a tonne by 2025 as supply conditions improve.
  • Australia’s exports are forecast to lift from an estimated 157 Mt in 2022–23 to 172 Mt in 2024–25 as several new mines open.
  • As prices decline, the value of Australia’s metallurgical coal exports is forecast to fall from $62 billion in 2022–23 to $41 billion in 2024–25.

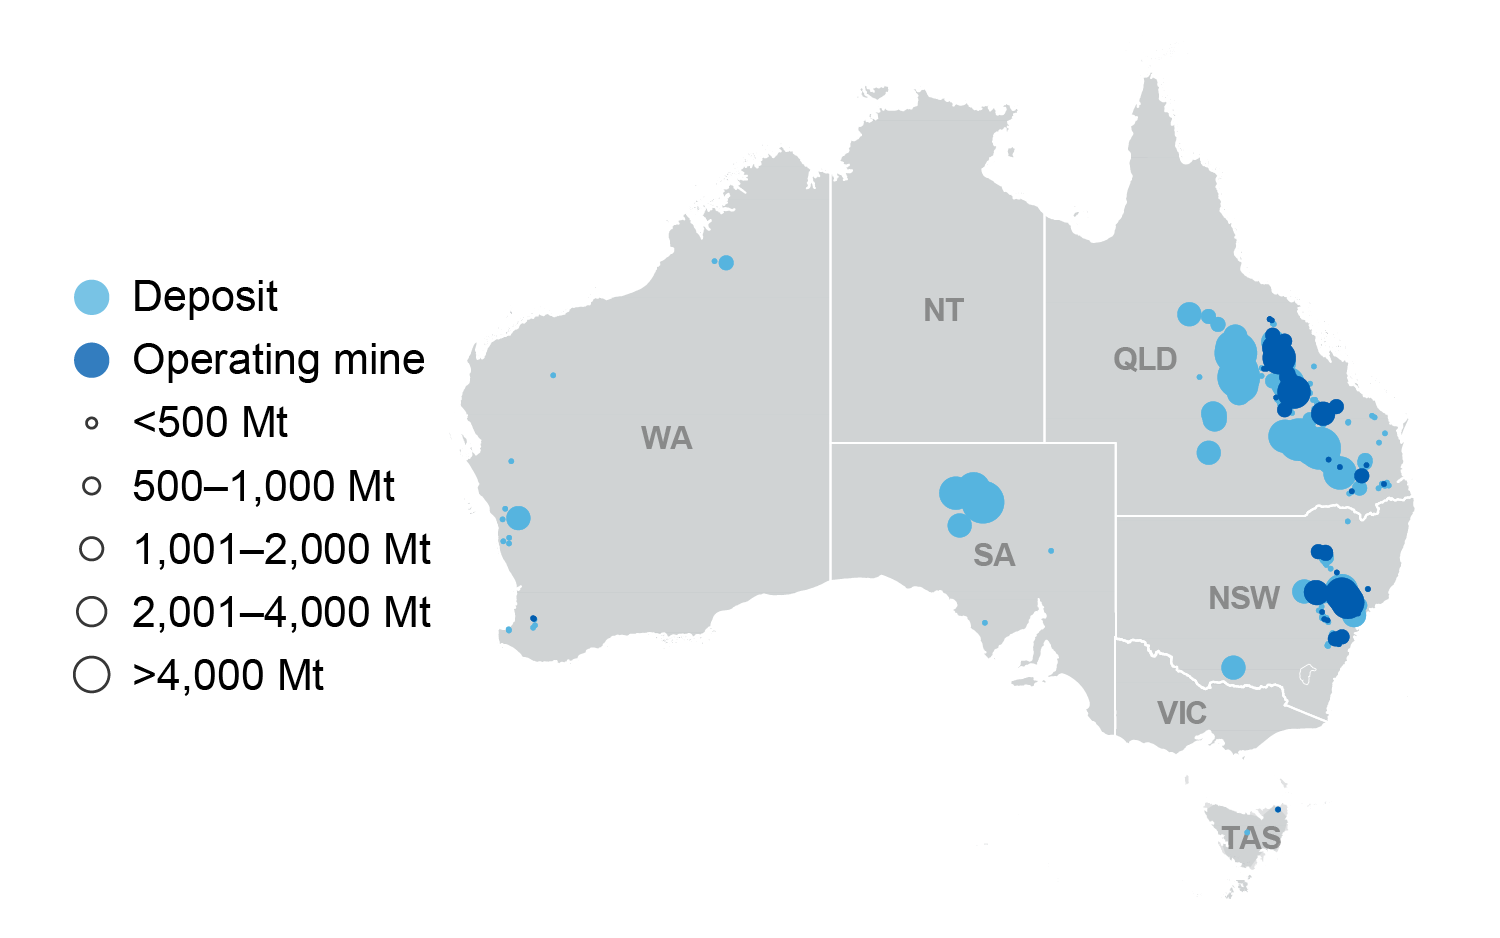
Major coal deposits

Map of major Australian coal deposits and mines. Most coal deposits are in Queensland and most operating mines are in New South Wales.

Thermal coal

Latest developments

Australia’s thermal coal export earnings have begun to decline as the global energy transition continues, with supply expected to hold while prices decline over the outlook period.

  • After an extraordinary spike in 2022, thermal coal prices fell back sharply in the first half of 2023, but have since stabilised at a relatively strong level. As global supply steadily lifts, the Newcastle benchmark price (6,000 kcal) is forecast to fall from almost US$180 a tonne over 2023 to around US$115 a tonne by 2025.
  • A gradual recovery from recent supply outages is expected to see Australian thermal coal exports rise from 182 Mt in 2022–23 to 203 Mt by 2024–25.
  • As prices decline, export values are forecast to fall from a peak above $65 billion in 2022–23 to around $28 billion by 2024–25.
     

Major coal deposits

Map of major Australian coal deposits and mines. Most coal deposits are in Queensland and most operating mines are in New South Wales.

Gas

Latest developments

Australia LNG earnings hit record levels in 2022–23, but falls are likely due to declining prices as energy markets continue to adjust to the fallout from Russia’s invasion of Ukraine.

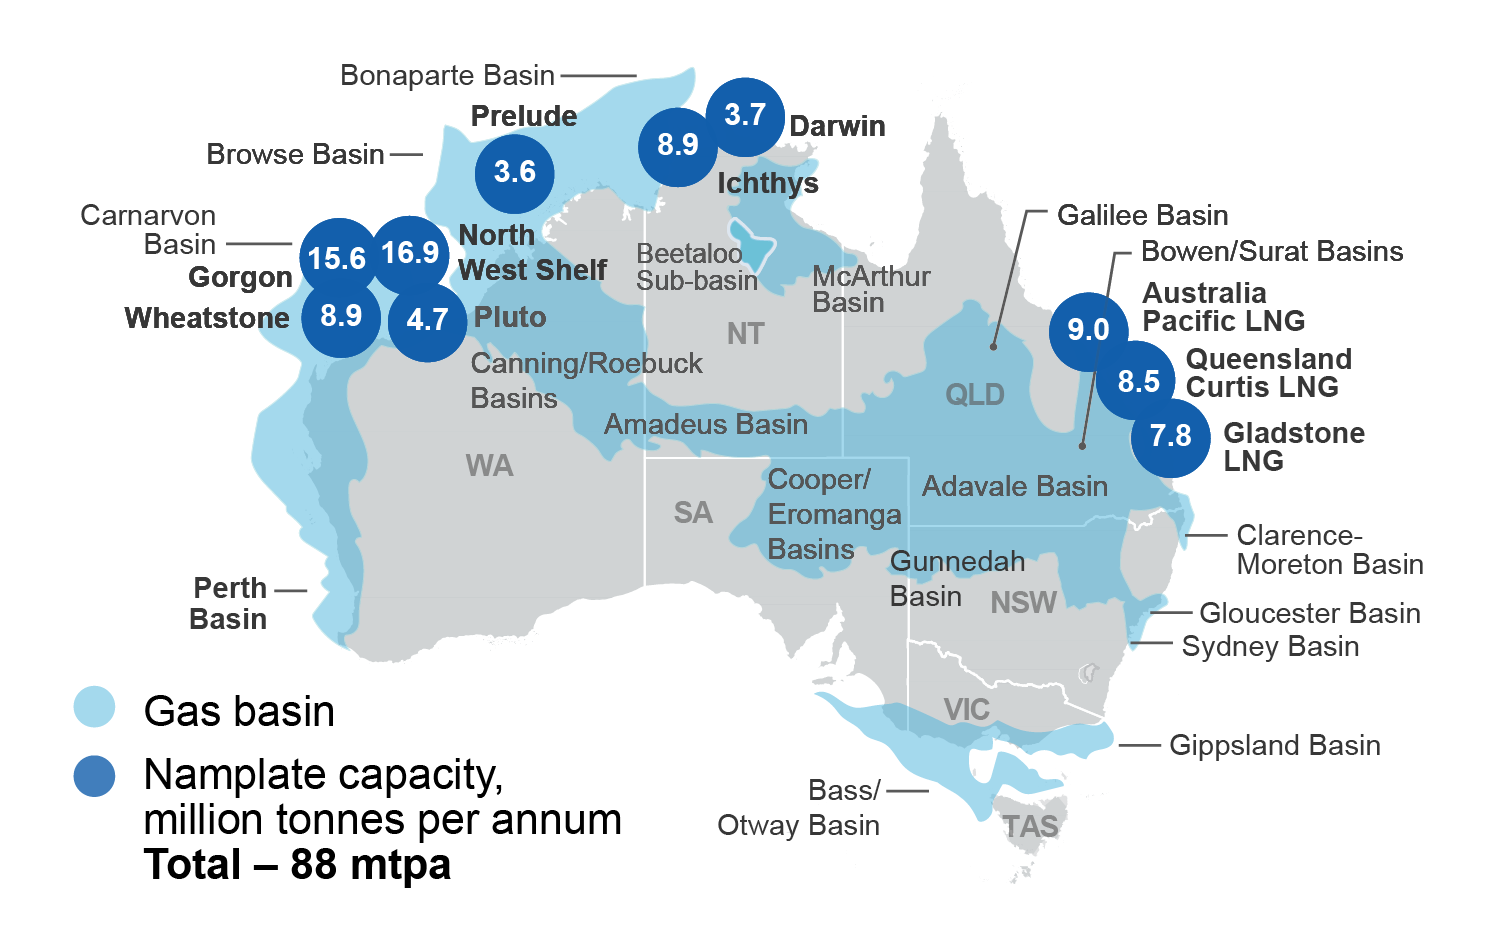
  • Australia’s LNG export revenues hit a record high of A$93 billion in 2022–23. But they are forecast to ease to A$71 billion in 2023–24 as the spike in global energy prices set off by the Russia–Ukraine war unwinds.
  • Asian LNG spot prices stabilised at US$12 per MMBtu over the September quarter as European storage inventories reach capacity, although the threat of industrial action (while downgraded) at Australian export facilities sparked a brief rally.
  • Global LNG markets are likely to tighten over the December and March quarters as winter in the Northern Hemisphere raises the demand for space heating, noting a mild 2022–23 winter. The severity of the Northern Hemisphere winter will determine the level of summer restocking demand for gas. 
     

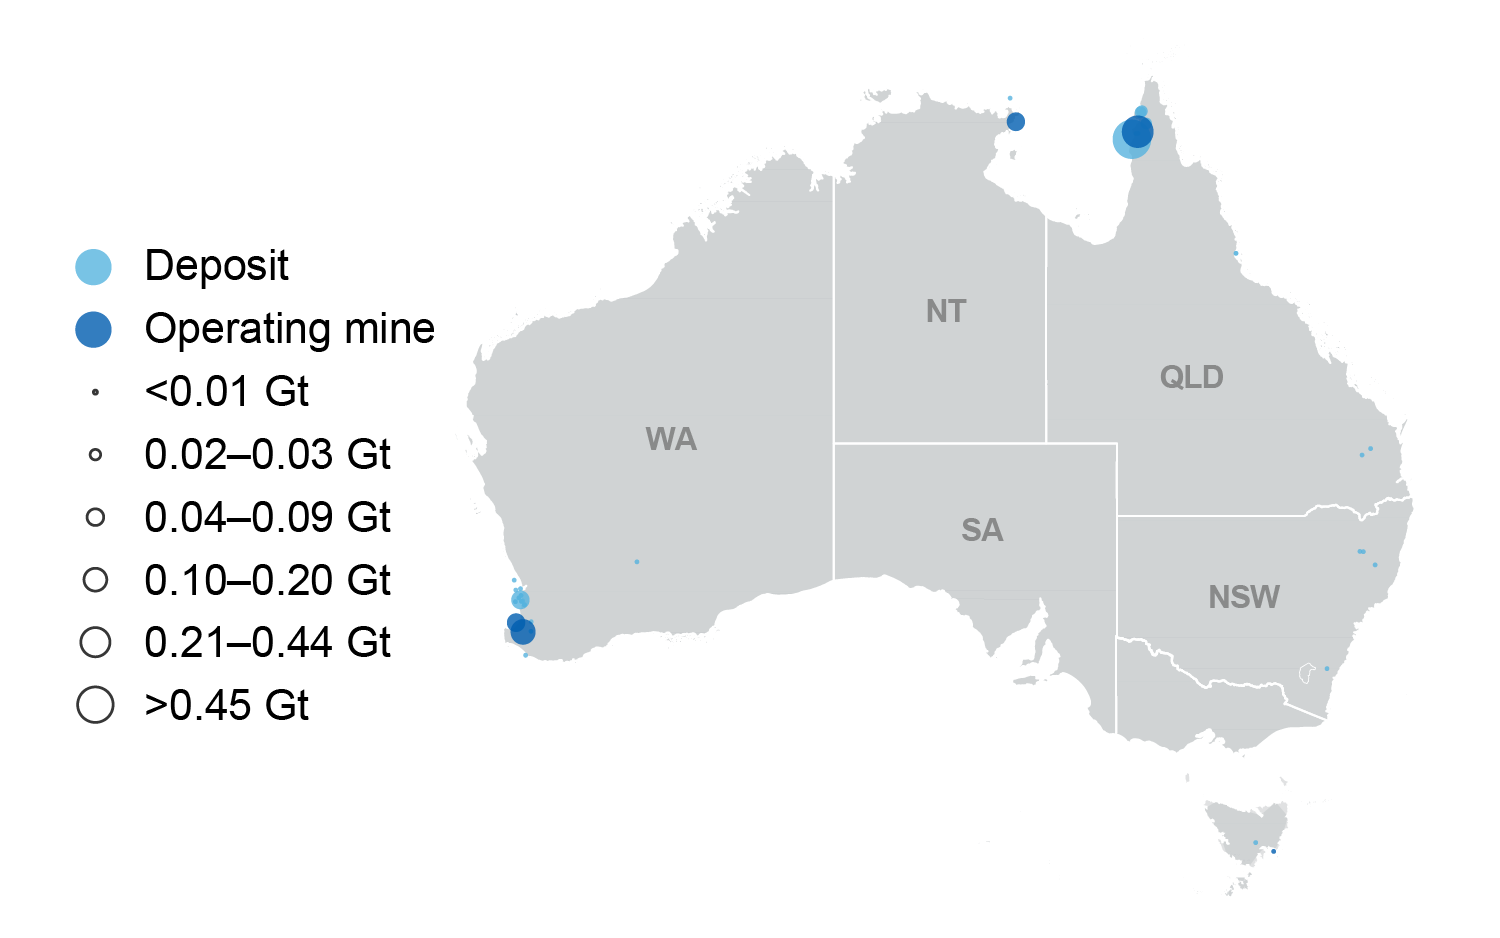
LNG projects and gas basins

Map of Australia showing that LNG projects are located in Queensland, the Northern Territory and Western Australia. Their combined nameplate capacity is 88 million tonnes per year

Oil

Latest developments

Revenue expectations are broadly similar to the June report. The oil market is expected to remain tight until sufficient North and Latin American supply is available as OPEC+ cuts back supply.

  • The Brent crude oil price is expected to average US$84 a barrel over 2023, as OPEC+ reduces output while a rebound in global transport demand drives higher oil usage. However, the price is expected to fall to around US$79 a barrel by 2025 as modest market surpluses emerge.
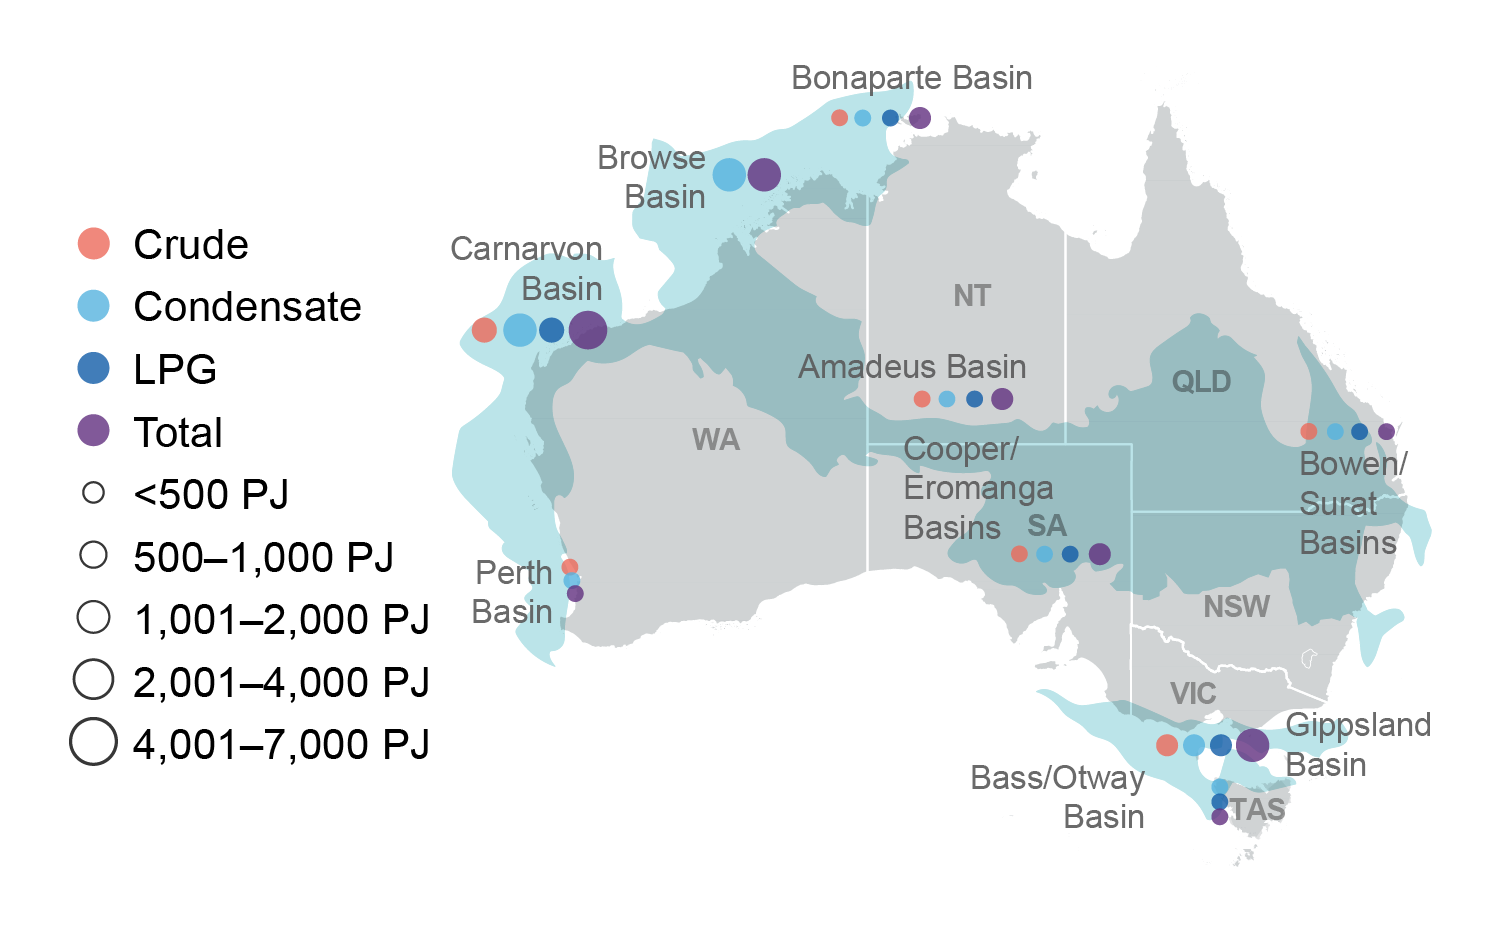
  • Australia’s crude and condensate production volumes are expected to fall to around 290 kilobarrels per day by 2024–25 as production at the North-West Shelf declines.
  • Australia’s crude and condensate export earnings are expected to lift to A$14.6 billion in 2023–24 as export volumes rise. This will fall to an expected A$11.9 billion in 2024–25 as prices fall and output declines at the North-West Shelf.

Crude oil, condensate and LPG resources

Map of Australia showing that around three-quarters of Australia's oil production comes from the Carnarvon Basin offshore Western Australia

Lithium

Latest developments

Lithium export revenue has been revised upward from June, although the outlook remains similar. Prices are expected to fall as the lithium market enters a sustained period of surplus supply. This will be partly offset by rising export volumes and a growing share of lithium refined to a higher value product domestically.

  • Record Australian lithium exports ($20 billion in 2022–23) are forecast to decrease to $16 billion in 2024–25 as lower prices offset higher export volumes. Prices are expected to fall due to the lithium market entering a sustained period of surplus supply, but will remain well above pre-2021 levels.
  • Australian lithium mine production continues growing due to expansions and new mines. Australia accounts for half of global lithium extraction, and rising production meets the growing global demand for lithium batteries.
  • Australia is developing capacity to refine lithium domestically. There are 3 lithium hydroxide refineries operating or under construction and a newly announced lithium phosphate refinery. This contributes to diversifying global lithium refining and developing Australia’s battery value chain.
     

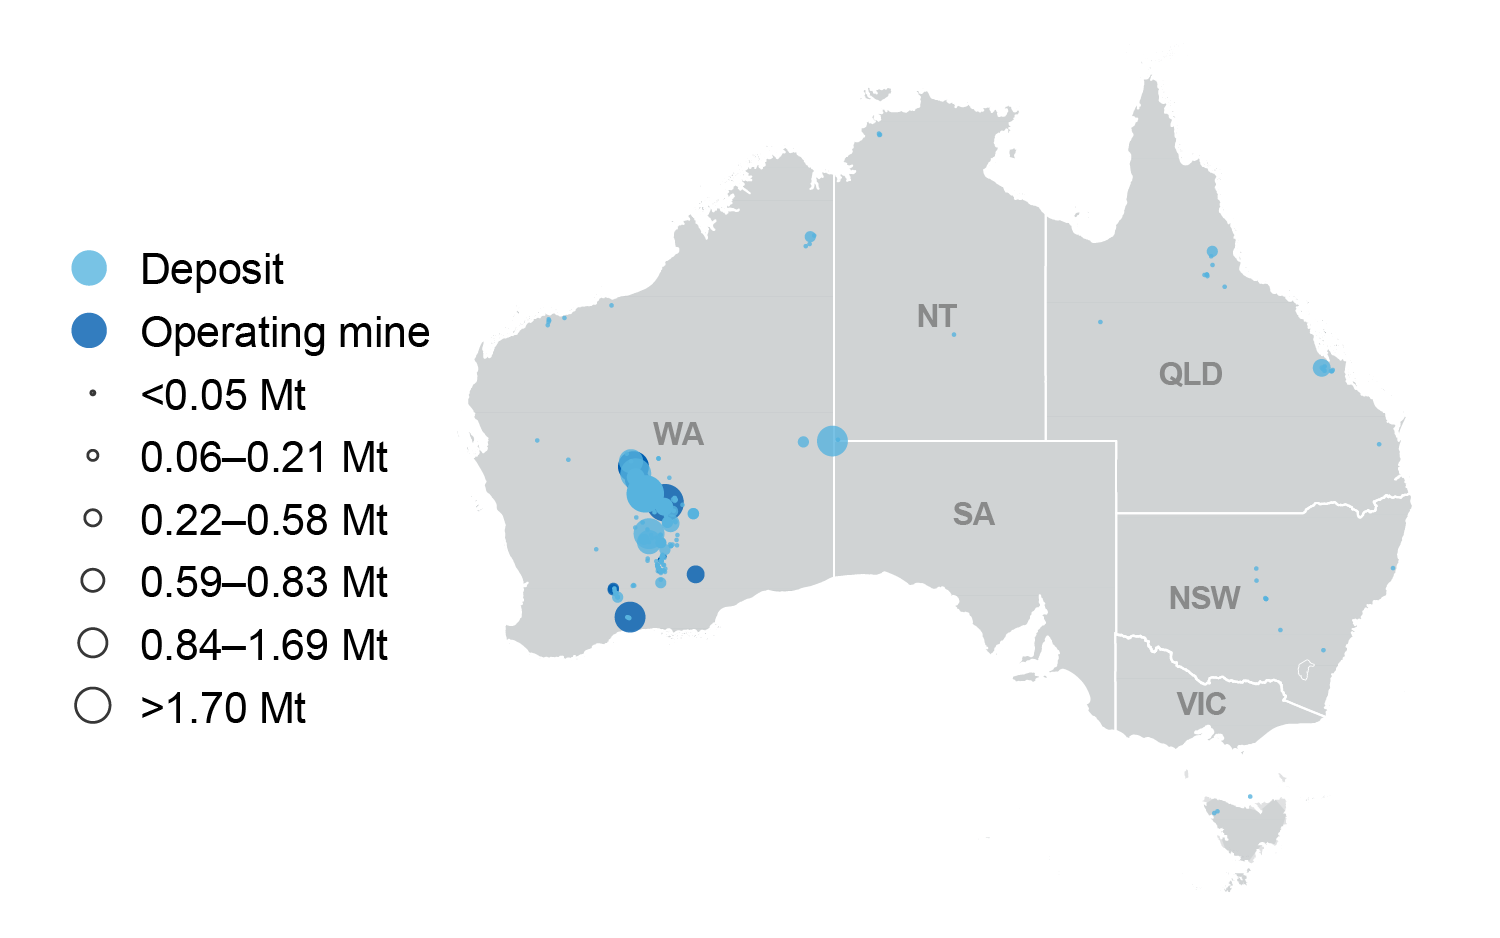
Major lithium deposits and mines

Map of Australia showing that all producing lithium mines and almost all deposits are located in Western Australia

Uranium

Latest developments

Uranium export earnings should rise, approaching $1 billion by 2024–25 as prices pick up and a new mine opens in South Australia.

  • Uranium prices are forecast to lift from US$50 a pound in 2022 to around US$64 a pound by 2025. Rising prices reflect sustained low global investment in new mines, which may result in emerging shortfalls in uranium supply.
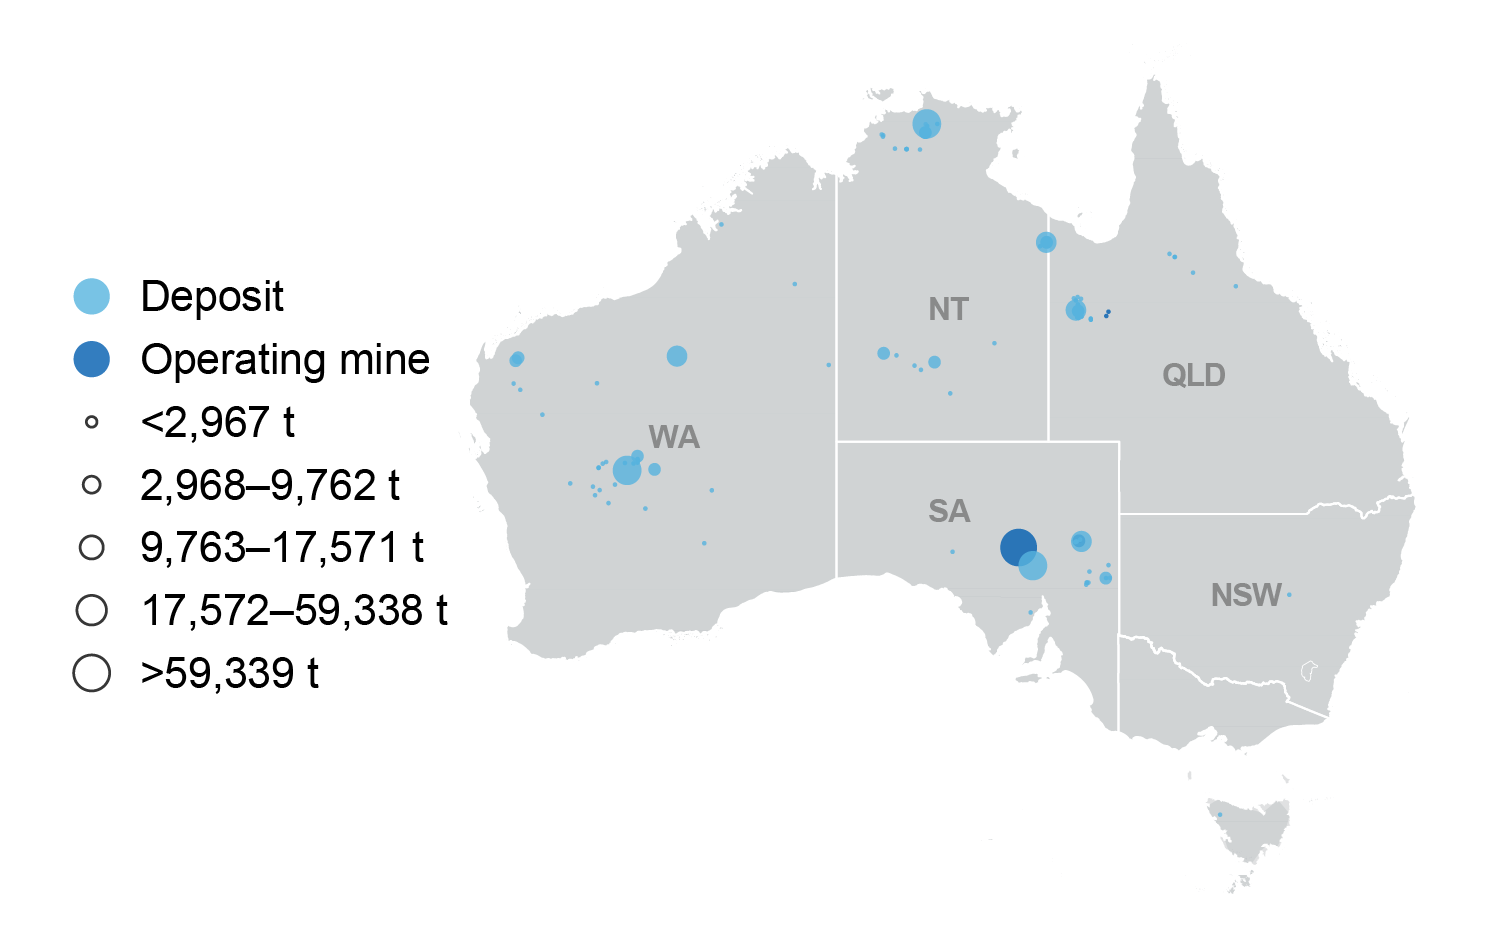
  • Australian exports are forecast to increase from around 5,400 tonnes in 2022–23 to around 6,000 tonnes by 2024–25. Output should be supported by the opening of Boss Energy’s Honeymoon mine in South Australia.
  • Price and volume growth are expected to drive uranium export values up from around $800 million in 2022–23 to $950 million by 2024–25.
     

Major uranium deposits

Map of Australia showing uranium deposits and operating mines

Gold

Latest developments

Australian gold export earnings are expected to decline over the forecast period as prices ease from the near-record highs of 2022–23. Compared to the June report, earnings have been revised higher in 2023–24 and 2024–25 due to higher forecast gold prices and a lower assumed exchange rate.

  • Gold prices averaged US$1,933 an ounce in the first half of 2023, supported by strong safe-haven buying and a slightly weaker US dollar. Over the outlook period, prices are forecast to remain elevated but decline gradually to average around US$1,830 an ounce in 2025.
  • Australian gold production decreased to 147 tonnes in the first half of 2023 due to disruption from heavy rainfall. Production is forecast to increase with new projects and expansions (see the ‘Australia’ section of the report for details).
  • Gold earnings are forecast to decrease from $24 billion in 2022–23 to around $22 billion in 2024–25, as lower prices outweigh higher volumes.

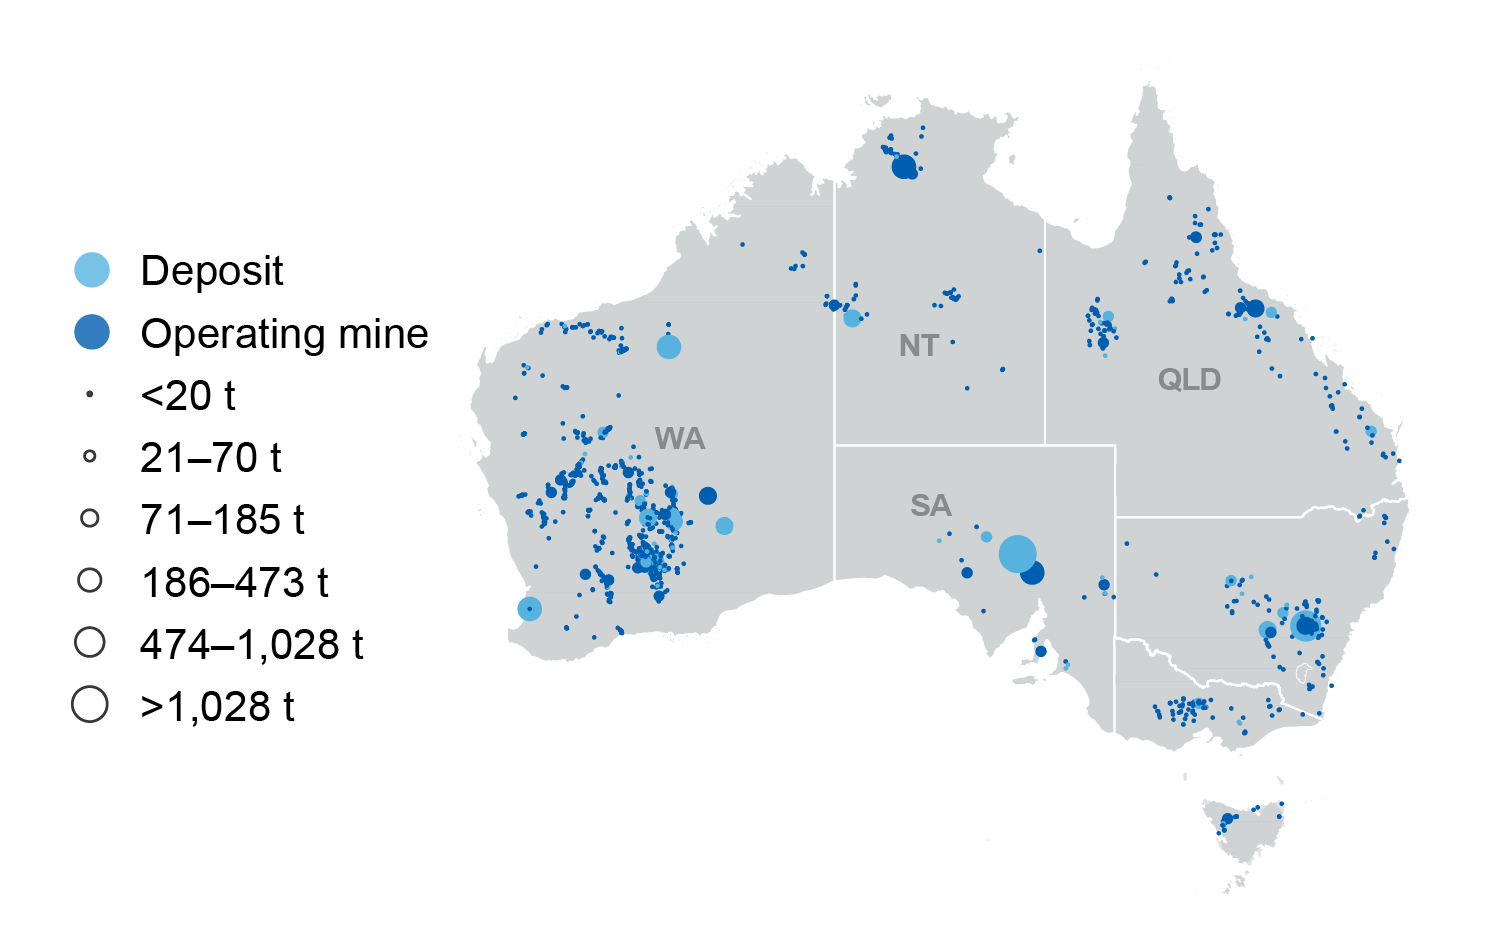
Major gold deposits

Map of Australia showing that most major gold deposits are in Western Australia

Aluminium, alumina and bauxite

Latest developments

Primary aluminium prices will fall in 2023 due to sluggish global demand. However, earnings should recover to $17 billion by the end of the outlook period as prices recover.

  • Primary aluminium prices declined in the September quarter on the back of rising supply from China and falling global demand.
  • Sluggish global construction activity is expected to be offset by higher demand from vehicle manufacturers, as output rises and efforts to raise the energy efficiency of vehicles lift aluminium usage.
  • Earnings for Australian exports of aluminium, alumina and bauxite are expected to rise from $16 billion in 2023–24 to $17 billion in 2024–25 as prices increase.

Major bauxite deposits

Map of Australia showing the locations of bauxite deposits and mines

Copper

Latest developments

Revenue expectations over the outlook remain broadly consistent with the June report. While the price outlook looks weaker compared to June, expectations for higher mined and refined export volumes have offset the price falls. 

  • Copper prices have continued to trend lower in recent months. This follows a weaker-than-expected economic recovery in China in 2023, as well as a deteriorating outlook for construction and manufacturing in other major markets such as Europe and ex-China Asia. 
  • The benchmark LME copper price is expected to average around US$8,300 a tonne for the second half of 2023 (compared with around US$8,700 a tonne in the first 6 months of this year).
  • Global copper consumption is expected to grow by 2.8% in 2023. China is expected to account for the bulk of this growth, with other major markets to see flat growth or modest declines.
  • Australian export earnings of copper are forecast to reach around $12.5 billion in 2023–24. Higher Australian production and export volumes will see export earnings reach $12.8 billion in 2024–25.

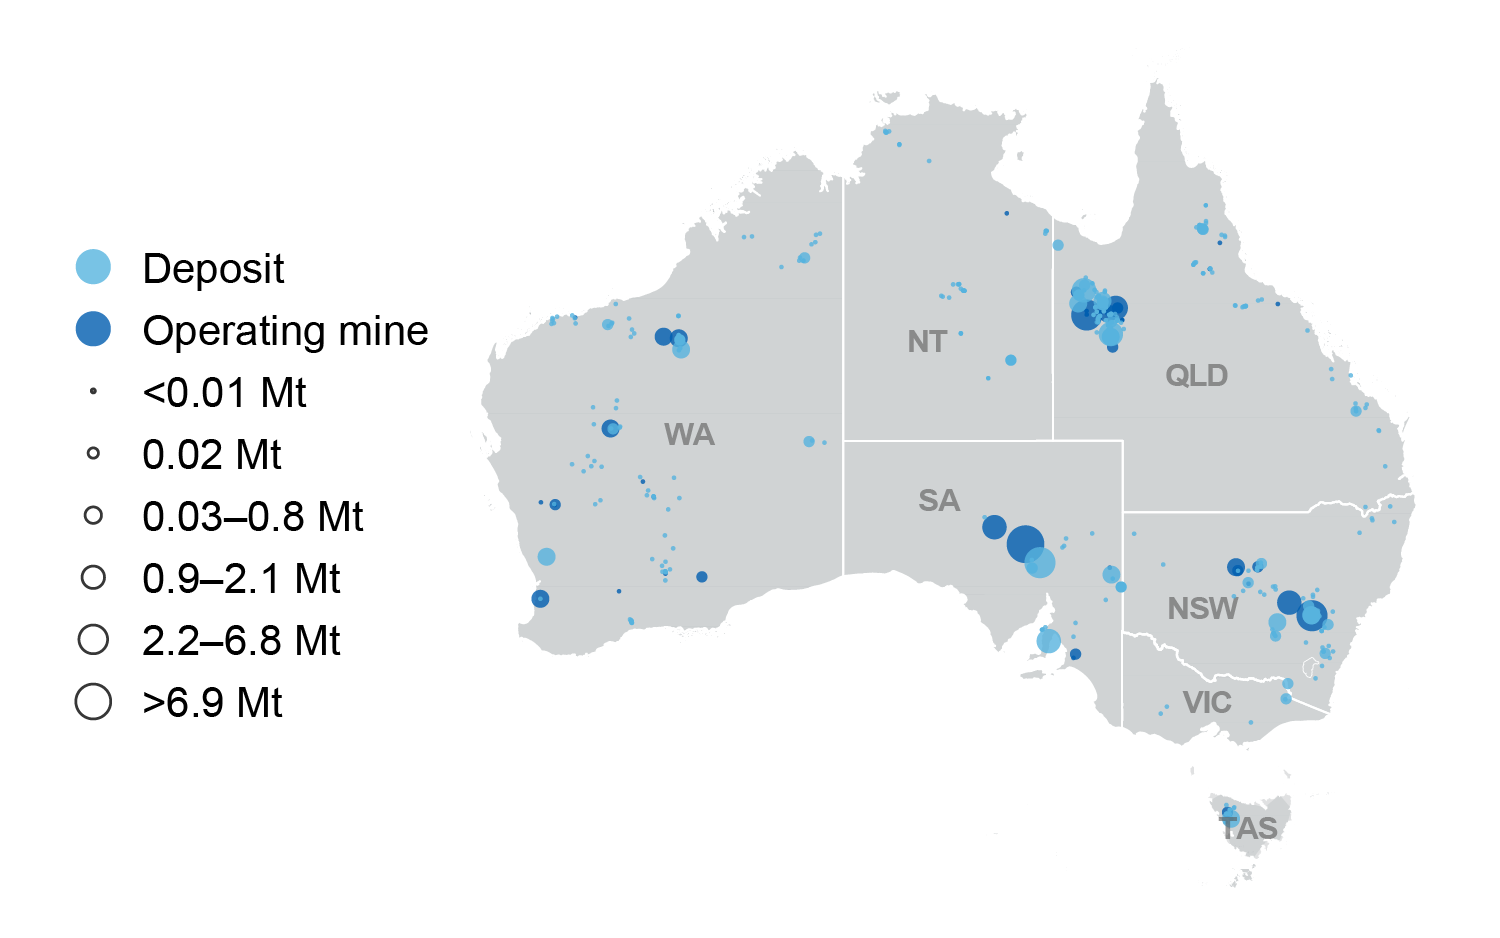
Major copper deposits

Map of Australia showing copper deposits are located in all states

Nickel

Latest developments

Forecast revenue in 2023–24 has been revised down slightly (compared to the June report) due to weaker price expectations. This follows an oversupply in global nickel markets. However, stronger export volumes due to new mines and refined supply in 2024–25 has seen projected export earnings revised upwards.

  • Chinese demand drove stronger global nickel consumption in the first half of 2023 despite a slower-than-expected economic recovery in China. Rising global macroeconomic headwinds in the second half of the year are expected to contain global growth in nickel consumption to around 3.2% in 2023.
  • An oversupply in the global nickel market is expected to persist over the outlook period, driven by growth in Indonesian (and some Chinese) mined and refined production. The existing oversupply in Class II nickel (primarily used for stainless steel) is also expected to spill over into the battery-grade nickel market during the outlook period.
  • Weaker prices over the outlook period are expected to see Australia’s nickel export earnings fall from $5 billion in 2022–23 to $4.3 billion in 2023–24. New production capacity in Australia is then expected to see a rebound in forecast earnings to $4.5 billion in 2024–25.

Major nickel deposits

Map of Australia showing most nickel deposits and all operating mines are located in Western Australa

Zinc

Latest developments

Revenue expectations have weakened since the June report. The outlook for zinc demand has weakened due to lower than expected Chinese demand. The outlook for Australian production also weakened with the closure of several small mines.

  • The zinc price declined noticeably in the September quarter due to lower than expected Chinese demand. China’s ongoing property crisis has weakened demand prospects over the outlook period, with the price forecast to average US$2,600 a tonne in 2025.
  • Australia’s zinc production is forecast to rise over the outlook period. The closure of several small mines in the June quarter will be offset by an expansion of the Century mine and a recovery in production at existing mines impacted by COVID disruptions.
  • Earnings from Australia’s zinc exports are forecast to fall to $3.7 billion by 2024–25, with higher volumes partially offsetting lower prices. 
     

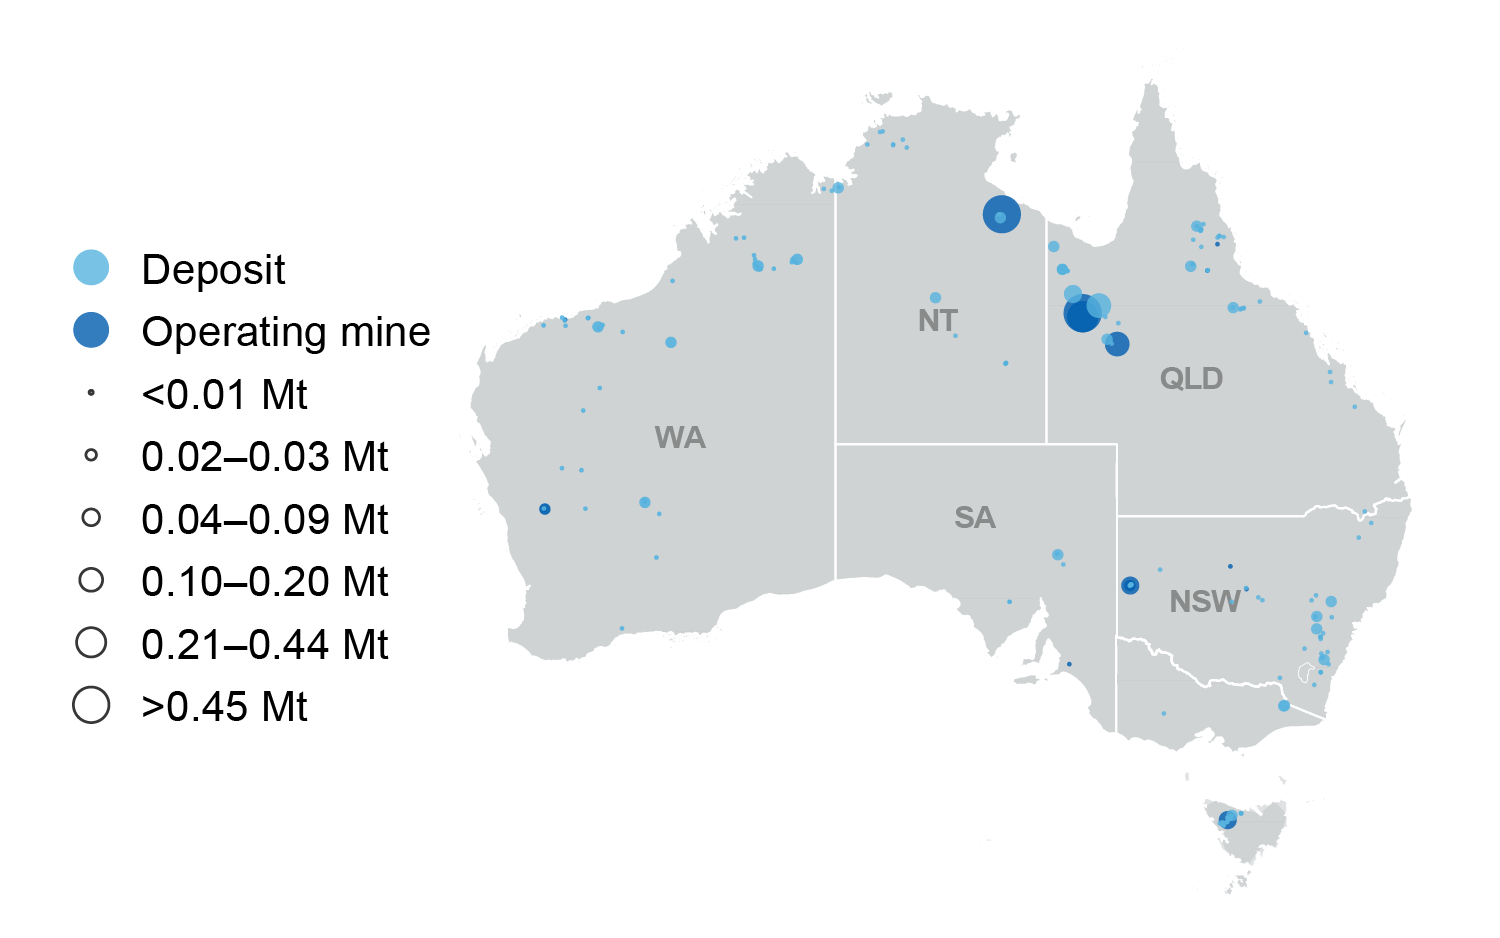
Major zinc deposits

Map of Australia showing zinc deposits in all states. The largest operating mines are in Queensland and the Northern Territory