|
Year |
Engineering |
Architecture, building |
Health |
Education |
Management, commerce |
Society, culture |
|---|---|---|---|---|---|---|
|
2015 |
10.4 |
3.7 |
5.9 |
4.2 |
13.4 |
8.3 |
|
2016 |
9.9 |
3.5 |
6.2 |
4.2 |
13.5 |
8.5 |
|
2017 |
9.7 |
3.5 |
6.5 |
4.2 |
13.6 |
8.6 |
|
2018 |
10 |
3.7 |
6.5 |
4.4 |
13.5 |
8.8 |
|
2019 |
9.9 |
3.6 |
6.4 |
4.5 |
14.1 |
8.8 |
|
2020 |
9.9 |
3.7 |
6.9 |
4.4 |
14.2 |
8.7 |
|
2021 |
10 |
3.9 |
7 |
4.6 |
14 |
8.9 |
|
2022 |
9.5 |
3.7 |
7.2 |
4.8 |
14.4 |
9.4 |
|
2023 |
9.8 |
3.8 |
7.5 |
4.8 |
14.1 |
9 |
|
2024 |
9.4 |
3.6 |
7.4 |
4.6 |
14 |
9.3 |
Skilled employees speed up the adoption and creation of innovations.
Adults with post-secondary school qualifications, top 6 fields

The proportion for adults with non-school qualifications in most of the depicted categories have seen an upward trend between 2015 and 2024. Note: This metric includes the top six fields in 2024. Data updated in August 2025, see the Recent AIS data updates page for details. Source: ABS 2015a, 2016a, 2017a, 2018b, 2019c, 2020b, 2021b, 2022b, 2023d, 2024i
Show text version
This metric presents the percentage of adults who hold non-school qualifications across 6 fields from 2015 to 2024. The proportion for adults with non-school qualifications in all six categories have seen an upward trend between 2015 and 2024. From 2015 to 2024, notable growth has been observed in management and commerce, along with health fields, whereas engineering and related technologies saw the least increase. See the full chart value of the data.
Specialist skills used for innovation, 2022–23

Non-STEM skills, including business management, are the most commons skills used for innovation. Larger firms use more skills for innovation. Source: ABS 2024d
Show text version
This metric presents skills used for innovation, by employment size, 2022–2023. It shows that business management skills dominate across all firm sizes, followed by information and communication technology skills. Among large firms, 72% used business skills for innovation, compared to 57.2% of medium-sized firms. This percentage is 45.2% for small firms and 37.5% for micro firms. For larger and medium firms, other skills are ranked third most important, but they drop to fourth for small and micro firms. The use of skills generally decreases with the size of the firm. A mere 5.9% of large firms report no skills necessary for innovation, compared to 18.3%, 27.2%, and 31.6% for medium, small, and micro firms, respectively. See the full chart value of the data.
Strategies for building ICT skills

The majority of businesses did not implement any management practices 2017–18 to 2021–22 (latest data available). Source: ABS 2019a, 2021a, 2023b
Show text version
This chart shows management practices implemented by firms regarding the use of ICTs across 2017–18, 2019–20 and 2021–22. The majority of businesses did not implement any management practice, however this proportion has fallen with 68.8% of firms not implementing a management practice in 2017–18 to 65.7% of firms in 2021–22. Of the practices included in the chart, the most common practice implemented was upgrading cybersecurity software, standard of protocols with 11% of firms implementing this practice in 2021–22. See the full chart value of the data.
Primary skilled migration applicants
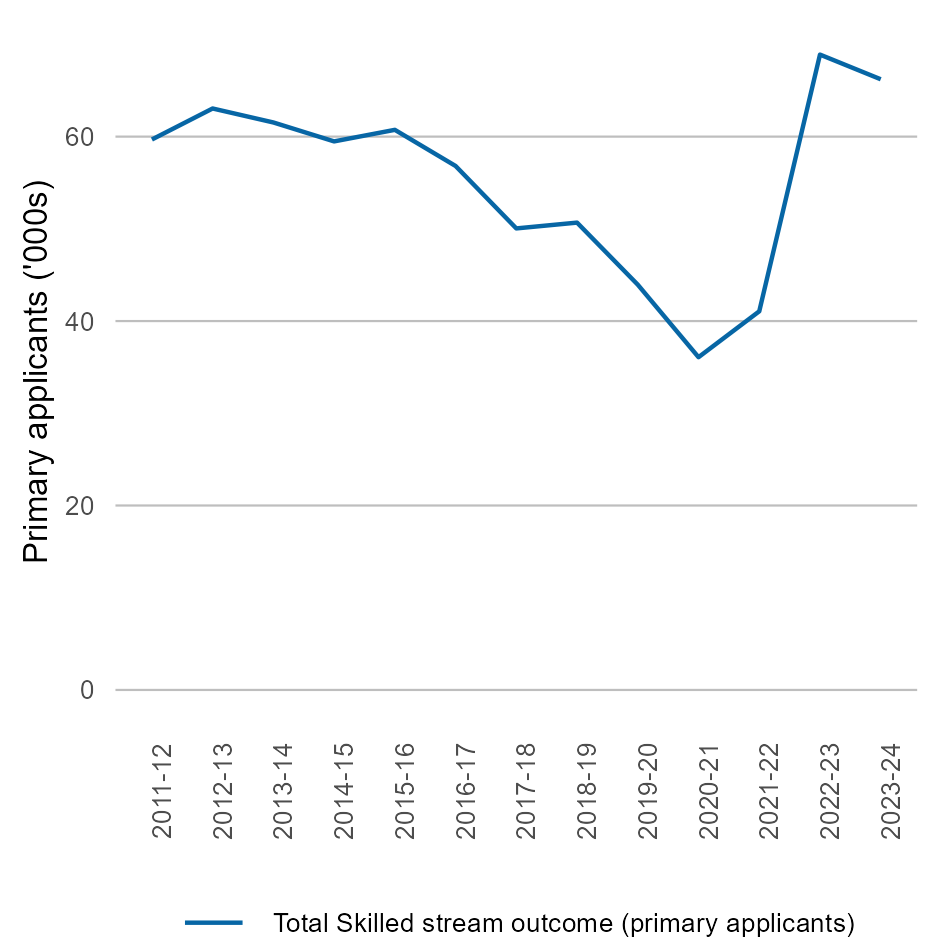
Skilled migration encourages the import of new ideas and skills. Data updated in August 2025, see the Recent AIS data updates page for details. Source: Department of Home Affairs 2024
Show text version
This metric shows the number of primary skilled stream visa applicants to Australia in 2011–12 to 2023–24. The number of applicants has fluctuated over time, particularly during the Covid-19 pandemic. In 2011–12 there were 59,686 primary skilled stream applicants, this has risen to 66,219 in 2023–24. See the full chart value of the data.
Employees with post-secondary school qualifications, by industry

This metric shows the top 6 sectors in 2023. Source: ABS 2016a, 2017a, 2018b, 2019c, 2020b, 2021b, 2022b, 2023d, 2024h
Show text version
This metric presents the percentage of employees with non-school qualifications in 6 sectors from 2016 to 2023. It shows that the Education and Training sector has the highest proportion of such employees (84.3% to 90.9%), followed by the Professional, Scientific, and Technical Services industry (80.1% to 88.3%), the Healthcare and Social Assistance industry (81.3% to 84.1%), and the Public Administration and Safety industry (74.2% to 80.3%). This figure has increased for Utilities and Financial and Insurance sectors, while it remained stable in other sectors from 2016 to 2023. See the full chart value of the data.
Employed persons job switching rate

Job switching encourages the sharing of ideas and skills between firms and sectors. Job switching rate is age-adjusted. Source: 2021c, 2023e, 2024f, 2024g
Show text version
This metric shows the age-adjusted job switching rate from 1994 to 2023. The rate decreased modestly from 7.8% in 1994 to 5.3% in 2021, before rising to 7% in 2023. See the full chart value of the data.
Human resources devoted to R&D

R&D resources in business and higher education sectors have significantly increased, while those in the government sector have decreased slighly. Source: ABS Cat 2012b, 2014d, 2015b, 2016c, 2016d, 2017b, 2018d, 2018e, 2019e, 2020c, 2020d, 2021d, 2022d, 2022e, 2023f, 2024j, 2024k
Show text version
This chart shows the number of human capital resources devoted to R&D across 3 sectors of the economy from 1992 to 2022. Across this period, the higher education sector had the largest number of human resources devoted to R&D apart from two years where the business sector exceeded it. In 1992, the business sector devoted 22,919 human resources to R&D, this increased to 91,414 in 2021. From 1992 to 2022, the number of human resources devoted to R&D in the higher education sector rose from 35,418 to 81,705. During the same period, the number of human resources devoted to R&D in the government sector decreased from 19,804 to 15,889. See the full chart value of the data.
Scientific publications, Australia and OECD average, by field

Australia's scientific publications in Natural Sciences, Medical and Health Sciences, Engineering and Technology and the Social Sciences consistently surpasses the OECD averages for every year. Data updated in August 2025, see the Recent AIS data updates page for details. Source: Clarivate 2025
Show text version
This metric shows the total number of scientific papers from Australia compared to the OECD averages, categorized by research disciplines, spanning from 2010 to 2024. Australia's leading fields include Natural Sciences, Medical Health Sciences, as well as Engineering and Technology. Research output in these research fields, along with the Social Sciences, consistently surpasses the OECD averages for every year. There has also been a continuous rise in Australian research publications within these 4 fields since 2010, reaching a peak in 2021, followed by a slight dip thereafter. The number of research papers in Agriculture and Veterinary Science, alongside Humanities and Arts, has remained relatively constant during the same period. See the full chart value of the data.
Chart values
| Specialist skill | Micro | Small | Medium | Large |
|---|---|---|---|---|
| Business management skills | 37.5 | 45.2 | 57.2 | 72 |
| ICT skills | 29.9 | 34.2 | 44.3 | 71.7 |
| STEM skills | 10.8 | 6.7 | 15.9 | 19.6 |
| Marketing | 22.1 | 27 | 28.9 | 34.1 |
| No skills required | 31.6 | 27.2 | 18.3 | 5.9 |
| Strategy | 2017–18 | 2019–20 | 2021–22 |
|---|---|---|---|
|
Staff skill targets
|
3.1 | 4.9 | 2.8 |
| Staff rewards for ICT innovation | 1.9 | 2.9 | 1.8 |
| External ICT consultants | 12.2 | 17.5 | 8.3 |
| Measured impact on business performance |
3.2 | 4.5 | 3.3 |
| Cybersecurity upgrades | 13.5 | 20.1 | 11 |
| No strategies implemented | 68.8 | 56.7 | 65.7 |
|
Year |
Primary skilled migration applications |
|---|---|
|
2011–12 |
59.686 |
|
2012–13 |
63.05 |
|
2013–14 |
61.535 |
|
2014–15 |
59.482 |
|
2015–16 |
60.735 |
|
2016–17 |
56.817 |
|
2017–18 |
50.046 |
|
2018–19 |
50.675 |
|
2019–20 |
43.944 |
|
2020–21 |
36.082 |
|
2021–22 |
41.058 |
|
2022–23 |
68.894 |
|
2023–24 |
66.219 |
| Year | Education | Utilities | Financials and insurance | Health, social care | Scientific, technical | Public administration |
|---|---|---|---|---|---|---|
| 2016 | 85.7 | 72 | 71.4 | 82.3 | 80.1 | 76.7 |
| 2017 | 84.9 | 62 | 75 | 81.3 | 84.8 | 79.6 |
| 2018 | 87.9 | 72 | 76.4 | 83.9 | 82.8 | 74.2 |
| 2019 | 89.2 | 72.4 | 80.4 | 81.8 | 84.6 | 78.2 |
| 2020 | 90.9 | 78.9 | 84.2 | 84 | 88.3 | 76.6 |
| 2021 | 84.3 | 75.1 | 80.7 | 83.6 | 87.7 | 78.1 |
| 2022 | 86.4 | 77.2 | 81.1 | 84.1 | 86.8 | 79.2 |
| 2023 | 86 | 74.4 | 77.3 | 82.8 | 85.2 | 80.3 |
|
Year |
Employed persons who changed jobs |
|---|---|
|
1994 |
7.78 |
|
1996 |
8.91 |
|
1998 |
6.96 |
|
2000 |
8.07 |
|
2002 |
7.64 |
|
2004 |
7.69 |
|
2006 |
8.20 |
|
2008 |
8.19 |
|
2010 |
6.30 |
|
2012 |
7.64 |
|
2013 |
6.61 |
|
2015 |
5.73 |
|
2016 |
5.73 |
|
2017 |
5.49 |
|
2018 |
5.71 |
|
2019 |
6.00 |
|
2020 |
5.68 |
|
2021 |
5.30 |
|
2022 |
6.61 |
|
2023 |
7.02 |
| Year | Business | Government | Higher education |
|---|---|---|---|
| 1992 | 22.919 | 19.804 | 35.418 |
| 1993 | 23.742 | ||
| 1994 | 25.812 | 19.309 | 40.096 |
| 1995 | 27.123 | ||
| 1996 | 26.412 | 19.19 | 42.739 |
| 1997 | 24.769 | ||
| 1998 | 25.109 | 18.422 | 45.502 |
| 1999 | 26.507 | ||
| 2000 | 28.391 | 18.151 | 46.287 |
| 2001 | 32.209 | ||
| 2002 | 35.939 | 18.542 | 49.612 |
| 2003 | 37.43 | ||
| 2004 | 40.458 | 16.687 | 55.204 |
| 2005 | 43.686 | ||
| 2006 | 46.462 | 16.76 | 58.905 |
| 2007 | 50.896 | ||
| 2008 | 53.886 | 17.042 | 61.773 |
| 2009 | 57.936 | ||
| 2010 | 56.511 | 69.199 | |
| 2011 | 64.906 | 16.689 | |
| 2012 | 16.381 | 74.669 | |
| 2013 | 78.839 | ||
| 2014 | 14.715 | 78.038 | |
| 2015 | 70.467 | ||
| 2016 | 14.773 | 79.008 | |
| 2017 | 74.991 | ||
| 2018 | 14.521 | 81.717 | |
| 2019 | 77.724 | ||
| 2020 | 15.047 | 81.09 | |
| 2021 | 91.414 | ||
| 2022 | 15.889 | 81.705 |
| Year | Natural Science | Medical, Health | Engineering, Technology | Social Science | Agricultural, Veterinary | Humanities, Arts | OECD Average |
|---|---|---|---|---|---|---|---|
| 2010 | 22311 | 17526 | 11099 | 11300 | 3490 | 2452 | 6956.333 |
| 2011 | 23957 | 19355 | 11664 | 13102 | 3797 | 2710 | 7211.833 |
| 2012 | 25769 | 20912 | 12999 | 13405 | 3760 | 2723 | 7473.5 |
| 2013 | 28400 | 23617 | 15185 | 15793 | 3971 | 3285 | 7806 |
| 2014 | 30245 | 25040 | 16444 | 16585 | 4306 | 3576 | 8179.333 |
| 2015 | 32742 | 26966 | 17977 | 18055 | 4574 | 3983 | 8400.5 |
| 2016 | 34448 | 28261 | 18955 | 18400 | 4974 | 4035 | 8718.667 |
| 2017 | 35414 | 29468 | 20636 | 19223 | 4907 | 4128 | 8955.167 |
| 2018 | 37131 | 31026 | 21509 | 19457 | 4924 | 3976 | 9071.833 |
| 2019 | 41202 | 35078 | 23631 | 22005 | 5381 | 4565 | 9829.167 |
| 2020 | 43031 | 37456 | 24589 | 22141 | 5777 | 4307 | 10135.33 |
| 2021 | 45769 | 40663 | 26838 | 21970 | 6170 | 4153 | 10602 |
| 2022 | 40921 | 37684 | 24001 | 19581 | 5324 | 3525 | 9685.333 |
| 2023 | 36113 | 33473 | 21546 | 17664 | 4831 | 3276 | 8899 |
| 2024 | 36510 | 34490 | 22330 | 18008 | 4905 | 3086 | 8972.833 |