|
Year |
Share of firms |
|---|---|
|
2006–07 |
36.8 |
|
2008–09 |
39.8 |
|
2010–11 |
39.1 |
|
2012–13 |
42.2 |
|
2014–15 |
45 |
|
2016–17 |
44.5 |
|
2018–19 |
43.9 |
|
2020–21 |
51.9 |
|
2022–23 |
45.7 |
Innovation encompasses the creation, adaptation and use of knowledge and technology.
Innovation-active firms in Australia

An innovation-active firm develops or implements new or improved products or processes. The share of innovation-active firms has been increasing from 36.8% in 2006–07 to 45.7% in 2022–23. Source: ABS 2008, 2010b, 2012a, 2014b, 2016b, 2018c, 2020a, 2022c, 2024d
Show text version
This chart shows Australia’s innovation-active firms, as a proportion of all firms from 2006–07 to 2022–23. The chart shows a gradual increase in the number of firms who are innovation-active over this period, from 36.8% in 2006–07 to 45.7% in 2022–23. See the full chart value of the data.
Innovation-active firms, top and bottom industries
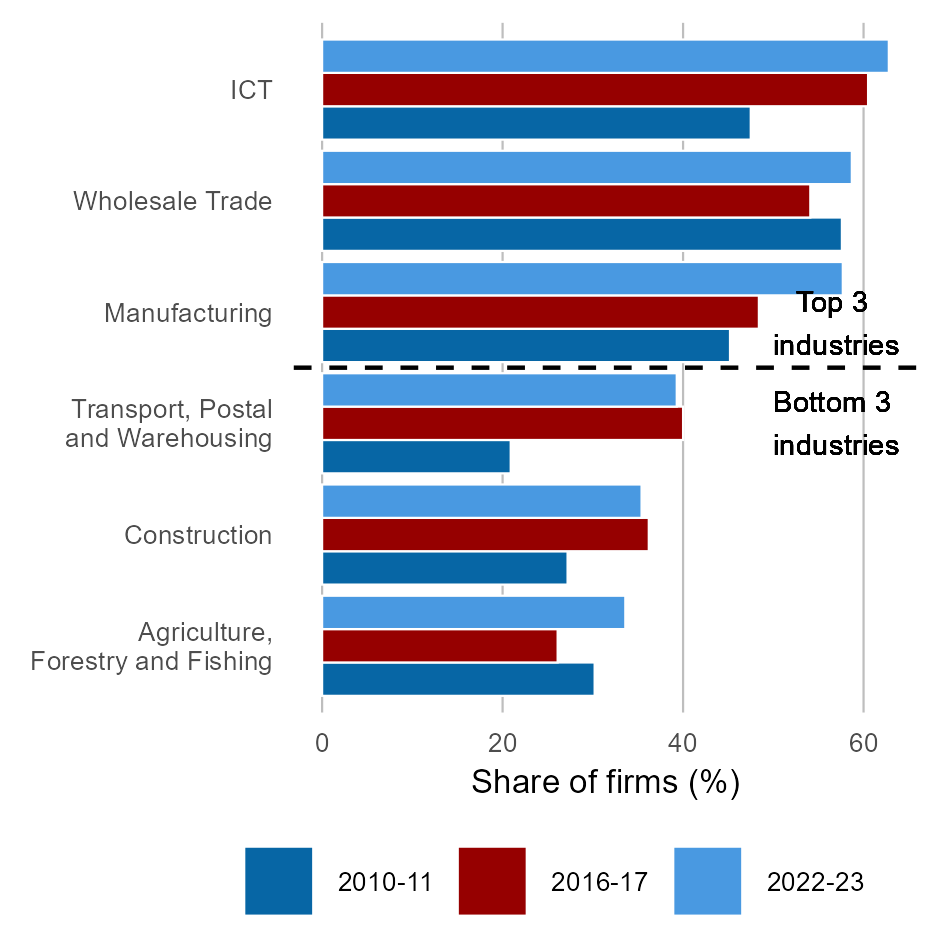
Innovation has become more prevalent in all depicted industries since 2010–11. The middle eleven industries in 2022–23 are not included in this chart. Source: ABS 2012a, 2018c, 2024d
Show text version
This chart shows 3 industries with the highest proportion of innovation-active firms, and the 3 industries with the lowest proportion of innovation-active firms, in 2022–23. For each industry, it shows the proportion of innovation-active firms at 6 year intervals, including 2010–11, 2016–17 and 2022–23. In 2022–23, the information, media and telecommunications industry has the most innovation-active firms at 62.8%, and the agriculture, forestry and fishing industry has the least innovation-active firms at 33.6%. Innovation has become more prevalent in all depicted industries since 2010–11. See the full chart value of the data.
Innovation-active firms, by employment size

Innovation has become more prevelant across most firm sizes since 2010–11. Employment size: micro = 0–4 persons; small = 5–19; medium = 20–199; large = 200+. Source: ABS 2012a, 2018c, 2024d
Show text version
This chart shows the proportion of innovation-active firms by employment size in Australia for 2010–11, 2016–17 and 2022–23. Innovation has become more prevalent across most firm sizes since 2010–11. In 2022–23, medium firms with 20–199 persons showed the highest prevalence of innovation-active firms, growing from 61.9% in 2010–11 to 64.9% in 2022–23. Small firms consistently have the lowest prevalence of innovation-active firms, growing from 30.5% in 2010–11 to 39.7% in 2022–23. See the full chart value of the data.
Innovation-active firms, by state/territory, 2022–23

Northern Territory had the highest prevalence of innovation-active firms and Tasmania had the lowest in 2022–23. Source: ABS 2012a, 2018c, 2024d
Show text version
This chart shows the proportion of innovation-active firms by state/territory 2022–23.
The states/territories with the highest prevalence of innovation-active firms are the Northern Territory with 47.9% and Queensland with 46.8%. The states/territories with the lowest prevalence of innovation-active firms are Tasmania with 38.7% and Western Australia with 41.8%. See the full chart value of the data.
Novelty of innovations adopted by Australian businesses
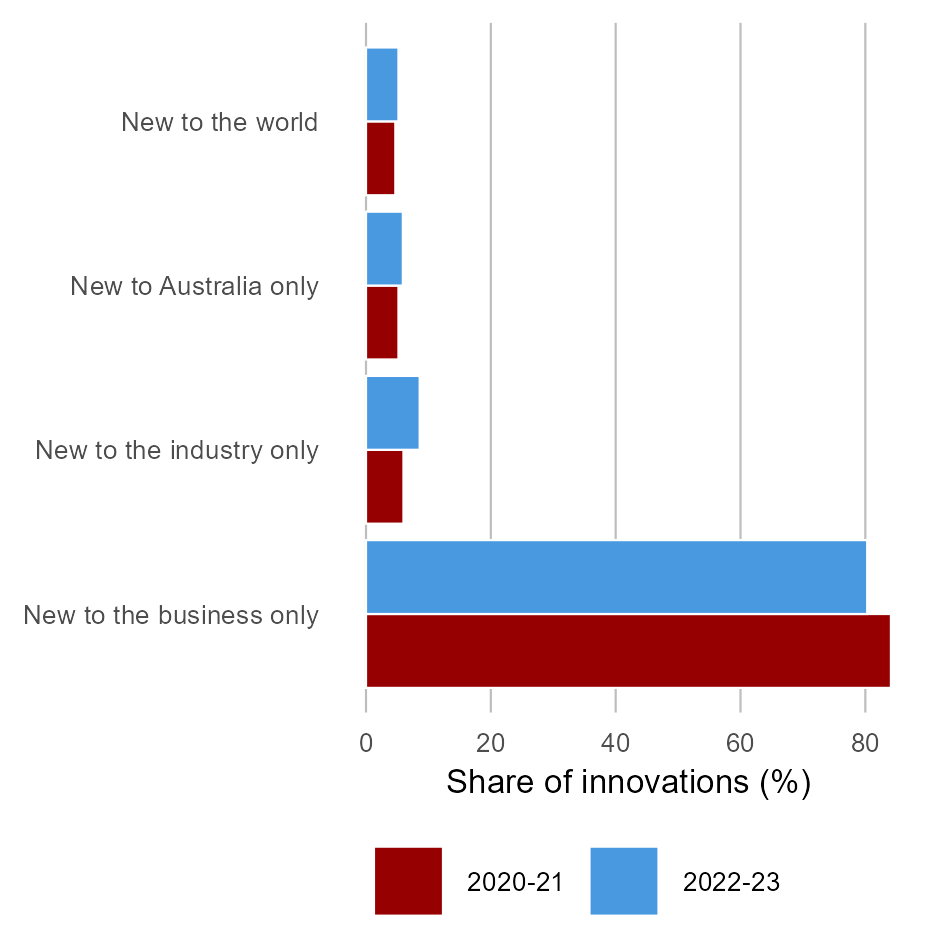
New to the world innovations indicate the creation of new ideas and technology. Most firms adopt existing technology. Source: ABS 2022c, 2024d
Show text version
This chart shows the novelty of most significant innovations introduced by innovating firms in 2020–21 and 2022–23. Across both periods it shows that only a very small number of innovations introduced by firms are new to the world innovations, but this has grown from 4.7% in 2020–21 to 5.2% in 2022–23. See the full chart value of the data.
Adoption of ICT innovations, top and bottom industries, 2021–22
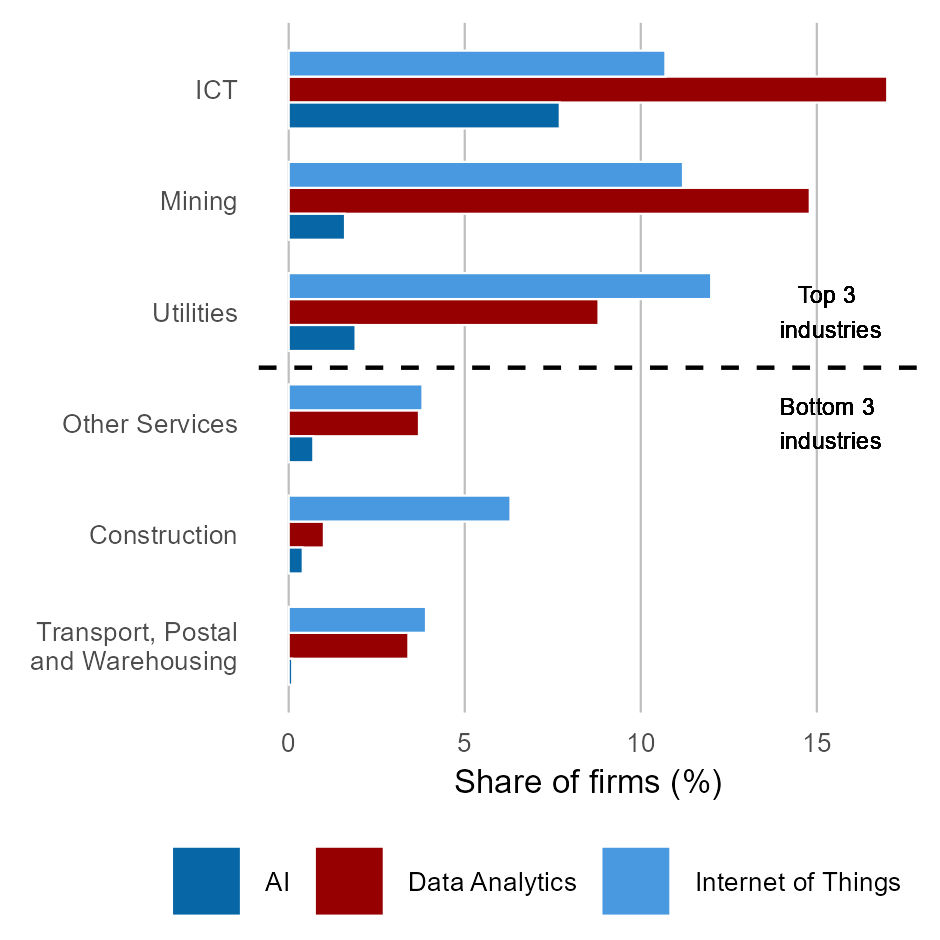
'AI' (Artificial Intelligence) examples: machine learning; advanced robotics. 'Data analytics' examples: big data; geospatial technology. 'Internet of things' examples: smart meters, security systems and appliances, wireless logistics tracking. This chart excludes the middle eleven industries based on their total rate of adoption. Source: ABS 2023b
Show text version
The chart shows the proportion of businesses that have adopted innovations using artificial intelligence, data analytics or the 'Internet of Things' for the financial year 2021–22 for selected industries. It includes the three top and three bottom industries by combined prevalence of these technologies.
It shows that firms in the ICT, mining and utilities sectors have adopted these technologies the most, while other service industries, have adopted these the least. Data analytics is the leading category for ICT (17%) and mining (14.8%), and Internet of Things is similar across the ICT (10.7%), mining (11.2%) and Utilities sectors (12%). Artificial intelligence generally has the lowest adoption across the industries. Note that figures on artificial intelligence are likely to have greatly increased since this survey was conducted, given the rapid increase of the use of generative AI in recent years. See the full chart value of the data.
Overseas patent families, Australia and USA

Australia is consistently below the USA-benchmark for the generation of foreign-oriented patent families (i.e. groups of patents related to a single invention). Source: WIPO 2023, World Bank Group 2024
Show text version
This chart shows the number of foreign-oriented patent families filed overseas per billions of dollars in GDP (constant 2015 US$) from 1980 to 2021 for Australia and USA. It shows that the USA has always generated more foreign-oriented patent families than Australia, and while the rate of the USA has continued to grow from 3.14 in 1990 to 3.7 in 2021, Australia's rate has declined from 1.97 in 1990 to 1.35 in 2021. See the full chart value of the data.
Productivity growth, 5-year mean, Australia and USA
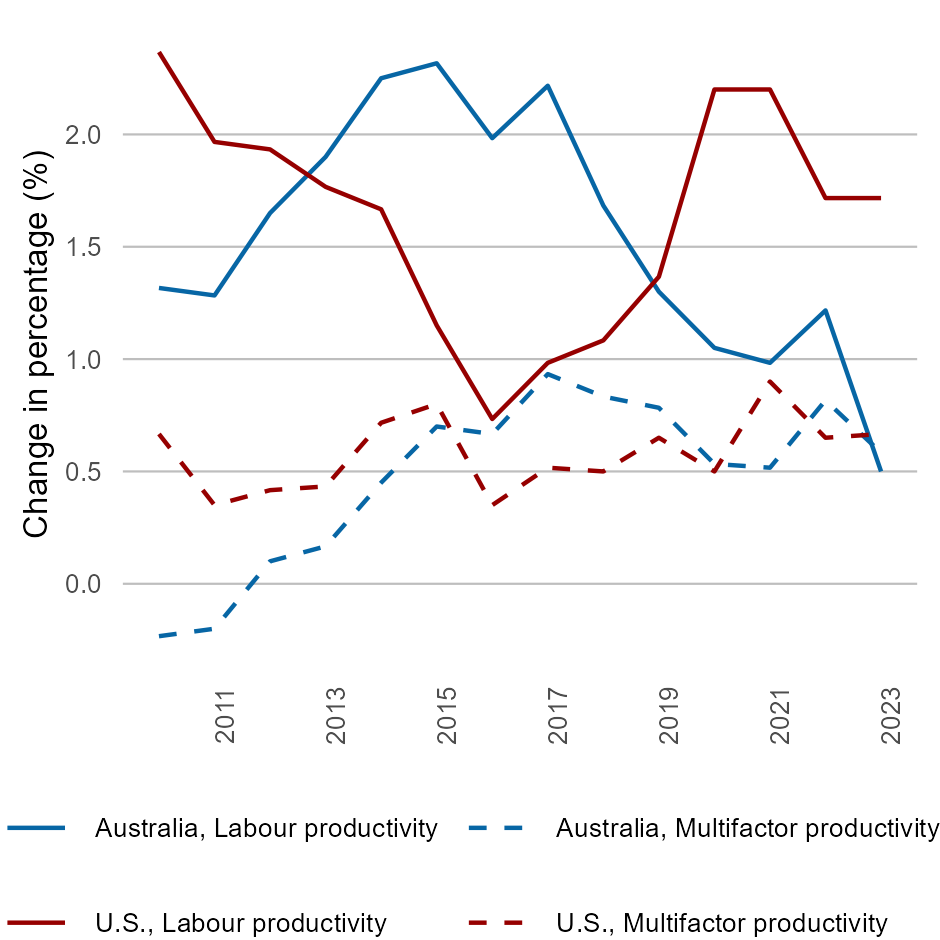
Innovation is a driver of productivity. Australian multifactor productivity has been similar to the USA-benchmark since 2015, while Australian labour productivity growth has been on the decline. Source: ABS 2023a, US Bureau of Labor Statistics 2024
Show text version
The metric shows the changes in the preceding 5 year average of labour and multifactor productivity as a percentage for Australia and the U.S. from 2009–10 to 2022–23. It indicates that multifactor productivity growth in the USA remained relatively flat at an average of 0.58%, while in Australia it experienced a mild rise from -0.23% to 0.58% between 2010 and 2023. From 2011 to 2016, labour productivity in the USA experienced a decline but has since mostly recovered, moving from 2.23% in 2010 to 1.71% in 2023. Since 2017, the growth of labour productivity in Australia has been on the decline, which is partly linked to the relatively slow adoption of new knowledge and technologies by businesses. See the full chart value of the data.
Self-reported increases in social contributions

Innovation-active firms consistently self-report higher social contributions. Note, self-reported increases may be subject to respondent bias. Source: ABS 2011, 2012c, 2013a, 2014f, 2015d, 2016e, 2017c, 2018f, 2020a, 2022c, 2024d
Show text version
This chart shows the percentage of firms (innovation-active firms and non innovation-active firms) that have reported an increase in social contributions, from 2009-10 to 2022-23. It highlights that a much larger fraction of innovation-active businesses, ranging from 8.2% to 17.9%, have self-reported increased in social contributions compared to their non-innovation-active counterparts (3.8% to 5.4%) for the same period. See the full chart value of the data.
Self-reported productivity increases

Innovation-active firms consistently self-report better productivity outcomes. Note: self-reported increases may be subject to respondent bias. Source: ABS 2011, 2012c, 2013a, 2014e, 2015c, 2016e, 2017c, 2018f, 2020a, 2022c, 2024d
Show text version
This chart shows the percentage of firms (innovation-active and non innovation-active firms) that have reported an increase in productivity, from 2009-10 to 2022-23. It highlights that a much larger fraction of innovation-active businesses, ranging from 22.6% to 35.1%, have self-reported productivity improvements compared to their non-innovation-active counterparts (10.7% to 18.4%) for the same period. The figures for both innovation-active and non-innovation-active businesses remained stable from 2009–10 to 2016–17, then dipped from 2018–19 to 2020–21, falling to 22.6% and 10.7%, respectively. The figures have since recovered in 2022–23. See the full chart value of the data.
Chart values
|
Industry |
2010–11 |
2016–17 |
2022–23 |
|---|---|---|---|
|
Agriculture, Forestry and Fishing |
30.2 |
26.1 |
33.6 |
|
Manufacturing |
45.2 |
48.4 |
57.7 |
|
Construction |
27.2 |
36.2 |
35.4 |
|
Wholesale Trade |
57.6 |
54.1 |
58.7 |
|
Transport, Postal |
20.9 |
40 |
39.3 |
|
ICT |
47.5 |
60.5 |
62.8 |
| Employment size | 2010–11 | 2016–17 | 2022–23 |
|---|---|---|---|
| Micro | 30.5 | 36.3 | 39.7 |
| Small | 49.6 | 56.9 | 54.5 |
| Medium | 61.9 | 60.6 | 64.9 |
| Large | 65.9 | 69.8 | 63.1 |
|
State/Territory |
Share of firms |
|---|---|
|
New South Wales |
45.3 |
|
Victoria |
46.8 |
|
South Australia |
47.3 |
|
Western Australia |
44.7 |
|
Tasmania |
41.8 |
|
Northern Territory |
38.7 |
|
Australian Capital Territory |
47.9 |
|
Novelty |
2020–21 |
2022–23 |
|---|---|---|
|
New to the world
|
4.7 |
5.2 |
|
New to Australia only |
5.2 |
5.9 |
|
New to the industry only |
6 |
8.6 |
|
New to the business only |
84.1 |
80.3 |
| Year | Australia | USA |
|---|---|---|
| 1980 | 1.974273 | 3.144344 |
| 1981 | 1.848285 | 3.035179 |
| 1982 | 1.786728 | 3.141111 |
| 1983 | 2.099044 | 3.126337 |
| 1984 | 2.185464 | 2.885902 |
| 1985 | 2.403558 | 2.841766 |
| 1986 | 2.239571 | 2.667083 |
| 1987 | 2.11854 | 2.806304 |
| 1988 | 1.924647 | 2.91896 |
| 1989 | 1.903793 | 3.040366 |
| 1990 | 1.682326 | 3.167322 |
| 1991 | 1.61223 | 3.10702 |
| 1992 | 1.684759 | 3.111983 |
| 1993 | 0.51279 | 3.111835 |
| 1994 | 2.586174 | 3.183986 |
| 1995 | 2.659049 | 3.426318 |
| 1996 | 2.312549 | 3.701553 |
| 1997 | 2.279135 | 3.551508 |
| 1998 | 2.774205 | 3.557891 |
| 1999 | 2.324627 | 3.642573 |
| 2000 | 3.198363 | 3.860128 |
| 2001 | 2.875417 | 3.680836 |
| 2002 | 2.902553 | 3.669134 |
| 2003 | 2.850112 | 3.669225 |
| 2004 | 3.221191 | 3.660509 |
| 2005 | 3.083712 | 3.683569 |
| 2006 | 2.80279 | 3.554388 |
| 2007 | 2.531785 | 3.443612 |
| 2008 | 2.301191 | 3.403761 |
| 2009 | 1.930246 | 3.49843 |
| 2010 | 1.878886 | 3.520452 |
| 2011 | 1.773477 | 3.911549 |
| 2012 | 1.610291 | 4.062075 |
| 2013 | 1.601196 | 4.359854 |
| 2014 | 1.578653 | 4.062448 |
| 2015 | 1.55352 | 4.101444 |
| 2016 | 1.517991 | 4.210246 |
| 2017 | 1.492736 | 4.302595 |
| 2018 | 1.602333 | 4.232473 |
| 2019 | 1.389508 | 4.112841 |
| 2020 | 1.381421 | 4.326857 |
| 2021 | 1.35548 | 3.692012 |
| Industry | AI | Data Analytics | Internet of Things |
|---|---|---|---|
| Mining | 1.6 | 14.8 | 11.2 |
| Utilities | 1.9 | 8.8 | 12 |
| Construction | 0.4 | 1 | 6.3 |
| Transport, Postal and Warehousing |
0.1 | 3.4 | 3.9 |
| ICT | 7.7 | 17 | 10.7 |
| Other Services | 0.7 | 3.7 | 3.8 |
|
Year |
Labour productivity (%) |
Multifactor productivity (%) |
||
|---|---|---|---|---|
|
Australia |
USA |
Australia |
USA |
|
|
2010 |
1.316667 |
2.366667 |
-0.23333 |
0.666667 |
|
2011 |
1.283333 |
1.966667 |
-0.2 |
0.35 |
|
2012 |
1.65 |
1.933333 |
0.1 |
0.416667 |
|
2013 |
1.9 |
1.766667 |
0.166667 |
0.433333 |
|
2014 |
2.25 |
1.666667 |
0.45 |
0.716667 |
|
2015 |
2.316667 |
1.15 |
0.7 |
0.8 |
|
2016 |
1.983333 |
0.733333 |
0.666667 |
0.35 |
|
2017 |
2.216667 |
0.983333 |
0.933333 |
0.516667 |
|
2018 |
1.683333 |
1.083333 |
0.833333 |
0.5 |
|
2019 |
1.3 |
1.366667 |
0.783333 |
0.65 |
|
2020 |
1.05 |
2.2 |
0.533333 |
0.5 |
|
2021 |
0.983333 |
2.2 |
0.516667 |
0.9 |
|
2022 |
1.216667 |
1.716667 |
0.816667 |
0.65 |
|
2023 |
0.5 |
1.716667 |
0.583333 |
0.666667 |
|
Year |
Innovation-active |
Non Innovation-active |
|---|---|---|
|
2009–10 |
35.1 |
16.4 |
|
2010–11 |
34.8 |
18.4 |
|
2011–12 |
34.1 |
14.2 |
|
2012–13 |
32.8 |
14.2 |
|
2013–14 |
30 |
14.3 |
|
2014–15 |
31.5 |
15.4 |
|
2015–16 |
30.2 |
15.1 |
|
2016–17 |
31.7 |
16.2 |
|
2018–19 |
29.3 |
12.8 |
|
2019–20 |
22.6 |
11.3 |
|
2020–21 |
24.3 |
10.7 |
|
2022–23 |
30.7 |
13.6 |
|
Year |
Innovation-active |
Non Innovation-active |
|---|---|---|
|
2009–10 |
13.4 |
5.4 |
|
2010–11 |
17.9 |
4.9 |
|
2011–12 |
13.8 |
4.6 |
|
2012–13 |
13.5 |
4.6 |
|
2013–14 |
12.5 |
3.8 |
|
2014–15 |
13.2 |
2.8 |
|
2015–16 |
12 |
3 |
|
2016–17 |
12 |
3.8 |
|
2018–19 |
12.4 |
3.7 |
|
2019–20 |
8.2 |
2.9 |
|
2020–21 |
10 |
2.5 |
|
2022–23 |
12.7 |
3.8 |