| Year | BERD | GOVERD | HERD | PNPERD |
|---|---|---|---|---|
| 2001 | 4982.558 | 2355.797 | 2789.753 | 289.038 |
| 2003 | 6940.292 | 2482.161 | 3429.597 | 359.548 |
| 2005 | 8676.456 | 2486.026 | 4327.162 | 478.861 |
| 2007 | 12639.28 | 3095.431 | 5433.529 | 608.916 |
| 2009 | 17291 | 3420 | 6844 | 744 |
| 2011 | 18007 | 3833 | 8161 | 914 |
| 2012 | 18321 | 3549 | 8885 | 944 |
| 2014 | 18849 | 3752 | 9919 | 952 |
| 2016 | 16659 | 3959 | 9549 | 1011 |
| 2018 | 17438 | 3329 | 11235 | 1060 |
| 2020 | 18171 | 3384 | 12714 | 1333 |
| 2022 | 20642 | 3691 | 12968 | 1450 |
R&D expenditure supports the creation of new ideas and knowledge.
Expenditure on R&D by sector ($ million)

Nominal R&D expenditure has grown in all sectors over the last 20 years. BERD = Business Expenditure on R&D, HERD = Higher Education Expenditure on R&D, PNPERD = Private Non-profit Expenditure on R&D. GovERD = Government (state + federal) expenditure on R&D. The SRI Budget Tables provide an alternative measure of government expenditure. See our SRI Budget Tables Insight for more details. Source: ABS 2010c, 2019e, 2019f, 2023f, 2023g
Show text version
This metric shows gross R&D spending by sector from 2001 to 2022, using nominal values. It indicates that the business sector has the highest nominal expenditure on R&D, followed by the higher education, government and private non-profit sectors. The data shows a consistent increase in nominal R&D expenditures across all sectors, with the business sector experiencing the most significant growth. Its spending has quadrupled from approximately $5,000 million in 2001 to over $20,00 million in 2022. The higher education sectors R&D spending also saw a substantial rise, from about $2,800 million to roughly $13,000 million. Meanwhile, the government and private non-profit sectors have witnessed modest increases in R&D expenditures during the same period. See the full chart value of the data.
Business R&D expenditure intensity, by industry

Businesses provide most R&D expenditure in Australia. R&D expenditure as a proportion of gross value added in an industry indicates how much research is occurring as a proportion of overall economic activity in the industry. Note: This chart includes the top six industries in 2023. Source: ABS 2015b, 2017b, 2019e, 2021d, 2023a, 2023f
Show text version
The chart shows the R&D expenditure intensity across 6 leading industries, measured as a percentage of Gross Value Added (GVA), from 2006 to 2022. It shows that the manufacturing sector has maintained a consistently stable lead in R&D expenditure intensity. However, the Professional, scientific, and technical services sector has seen a significant rise, eventually surpassing manufacturing around 2020. Over the last decade, the Professional, scientific, and technical services sector experienced the most substantial growth in R&D expenditure intensity, climbing from 3.05% in 2011 to 4.22% in 2022. Meanwhile, the R&D expenditure intensity for the Financial and insurance services, Information media and telecommunications, and Wholesale trade industries has remained stable at 1.9%, 1.5%, and 1.09%, respectively. R&D expenditure intensity also saw a modest increase in Other Service industry. See the full chart value of the data.
Expenditure on R&D by sector (% of GDP)
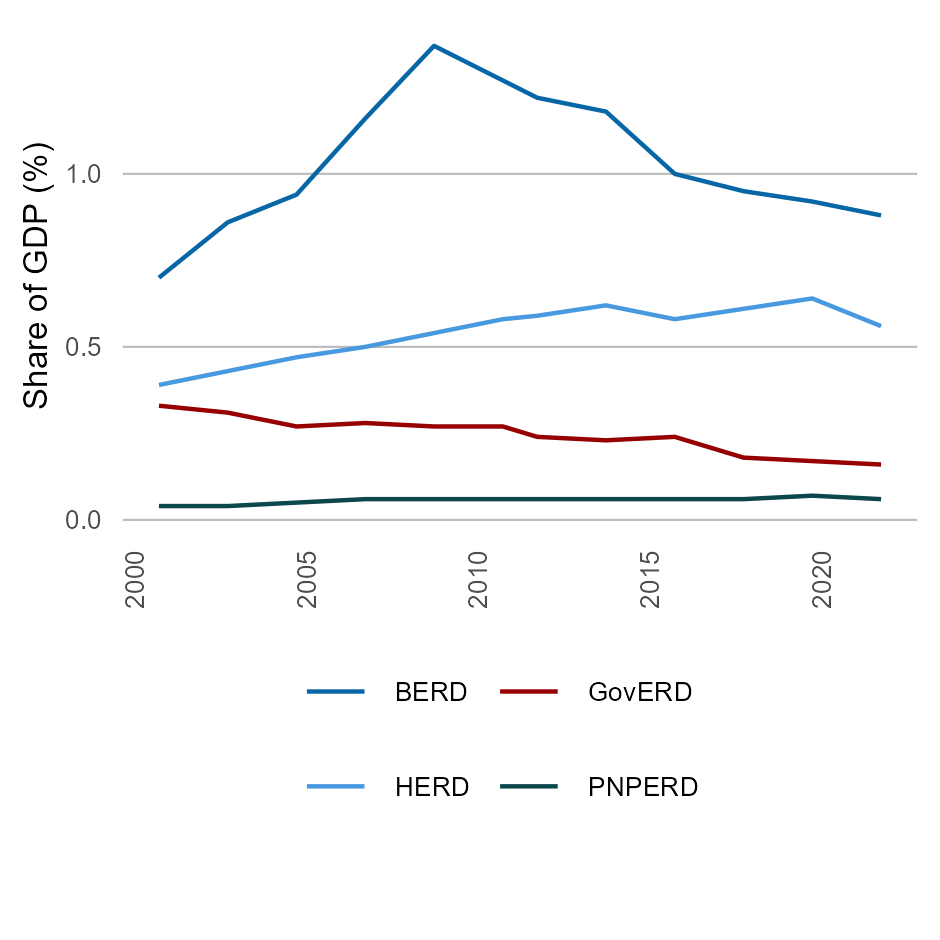
While nominal R&D expenditure in all sectors has grown in recent times, GDP has grown faster. R&D expenditure as a proportion of GDP has thus declined. The majority of R&D expenditure in the Australian economy occurs in the business and higher education sectors. Source: ABS 2010c, 2019e, 2019f, 2023f, 2023g, 2024a
Show text version
This metric shows gross R&D spending by sector as a proportion of GDP from 2001 to 2022. It indicates that the business sector has the largest share of R&D spending, followed by the higher education, government and private non-profit sectors. The business sector saw an increase in R&D investment as a proportion of GDP until 2009, but it fell from 1.37% to 0.88% in 2022. In contrast, the higher education sector experienced a slight rise from 0.39% to 0.56%, while the government sector saw a decrease in R&D expenditure over time. R&D spending as a proportion of GDP in the private non-profit sector has remained stable at around 0.05%. See the full chart value of the data.
Chart values
| Year | BERD | GOVERD | HERD | PNPERD |
|---|---|---|---|---|
| 2001 | 0.7 | 0.33 | 0.39 | 0.04 |
| 2003 | 0.86 | 0.31 | 0.43 | 0.04 |
| 2005 | 0.94 | 0.27 | 0.47 | 0.05 |
| 2007 | 1.16 | 0.28 | 0.5 | 0.06 |
| 2009 | 1.37 | 0.27 | 0.54 | 0.06 |
| 2011 | 1.27 | 0.27 | 0.58 | 0.06 |
| 2012 | 1.22 | 0.24 | 0.59 | 0.06 |
| 2014 | 1.18 | 0.23 | 0.62 | 0.06 |
| 2016 | 1 | 0.24 | 0.58 | 0.06 |
| 2018 | 0.95 | 0.18 | 0.61 | 0.06 |
| 2020 | 0.92 | 0.17 | 0.64 | 0.07 |
| 2022 | 0.88 | 0.16 | 0.56 | 0.06 |
| Year | Financial and Insurance | ICT | Manufacturing | Other Services | Professional | Wholesale trade |
|---|---|---|---|---|---|---|
| 2005-06 | 1.29 | 1.34 | 3.77 | 0.21 | 3.28 | 1.49 |
| 2006-07 | 1.32 | 2.26 | 3.8 | 0.22 | 3.18 | 1.72 |
| 2007-08 | 1.62 | 2.16 | 4.03 | 0.27 | 3.29 | 1.63 |
| 2008-09 | 2.15 | 2.11 | 4.12 | 0.25 | 3.32 | 1.65 |
| 2009-10 | 2.58 | 1.16 | 4.09 | 0.25 | 3.05 | 1.37 |
| 2010-11 | 2.6 | 1.35 | 4.6 | 0.24 | 2.99 | 1.21 |
| 2011-12 | 2.7 | 1.65 | 4.23 | 0.22 | 2.86 | 1.14 |
| 2013-14 | 2.57 | 1.32 | 4.76 | 0.48 | 3.62 | 1.49 |
| 2015-16 | 2.43 | 2.43 | 2.43 | 2.43 | 2.43 | 2.43 |
| 2017-18 | 2.01 | 1.33 | 4.32 | 0.54 | 4.1 | 1.34 |
| 2019-20 | 1.84 | 1.13 | 4.27 | 0.99 | 4.37 | 1.13 |
| 2021-22 | 1.91 | 1.5 | 4.13 | NA | 4.22 | 1.09 |