| Partner | 2016–17 | 2020–21 | 2022–23 |
|---|---|---|---|
| Within enterprise group | 28 | 23.7 | 26.6 |
|
Suppliers
|
39.8 | 46.4 | 40.9 |
| Customers or clients | 37 | 46.6 | 42.2 |
|
Consultants
|
32.3 | 42.1 | 44.1 |
| Competitors, other businesses | 24.4 | 23.7 | 22.7 |
| Higher education institutions | 5 | 8 | 9.1 |
Collaboration supports the exchange of good ideas and useful technologies.
Innovation collaboration, top 6 partners
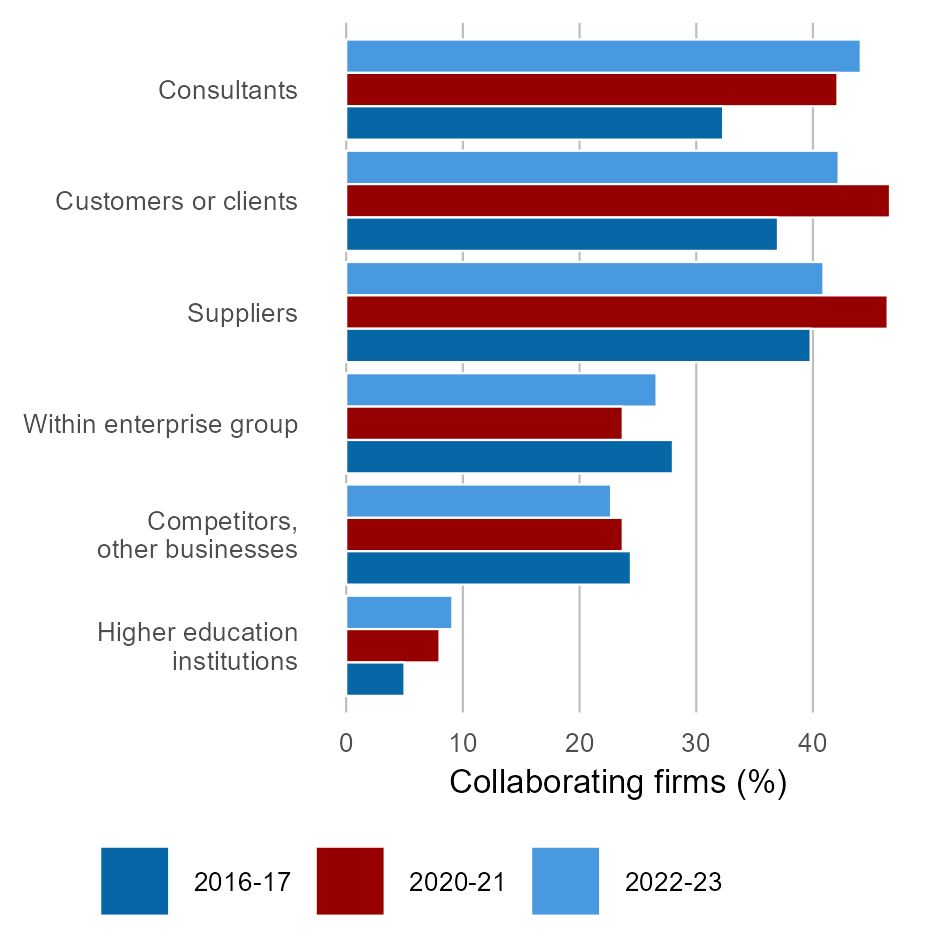
Consultants, clients and suppliers are consistently the top collaboration partners for innovation. Source: ABS 2018c, 2022c, 2024d
Show text version
This chart shows the collaboration partner for innovation-active firms who collaborated for innovation purposes across the 2016–17, 2020–21 and 2022–23 years. Collaborating firms are increasingly collaborating with consultants, 44.1% in 2022–23 from 32.2% in 2016–17.
Other common collaboration partners for firms include suppliers, customers or clients and other businesses owned by the same company. See the full chart value of the data.
Australian international co-authorship publications, by research field

International co-authorship publications are an indicator of international collaboration on innovation. Data updated in August 2025, see Recent AIS data updates page for details. Source: Clarivate 2025
Show text version
This metric shows the proportion of Australian international co-authored research publications by research field from 2000 to 2024. The chart reveals a steady increase in Australian papers with international co-authors across all research fields over the past 23 years. Engineering and Technology lead in international collaborations, followed by Natural Sciences, and Medical and Health Sciences. International co-authorship in Engineering and Technology has seen a threefold increase during this period. The proportion of Australian international co-authored research publications in all other research fields has at least doubled over the same timeframe. See the full chart value of the data.
Australian co-invention patents
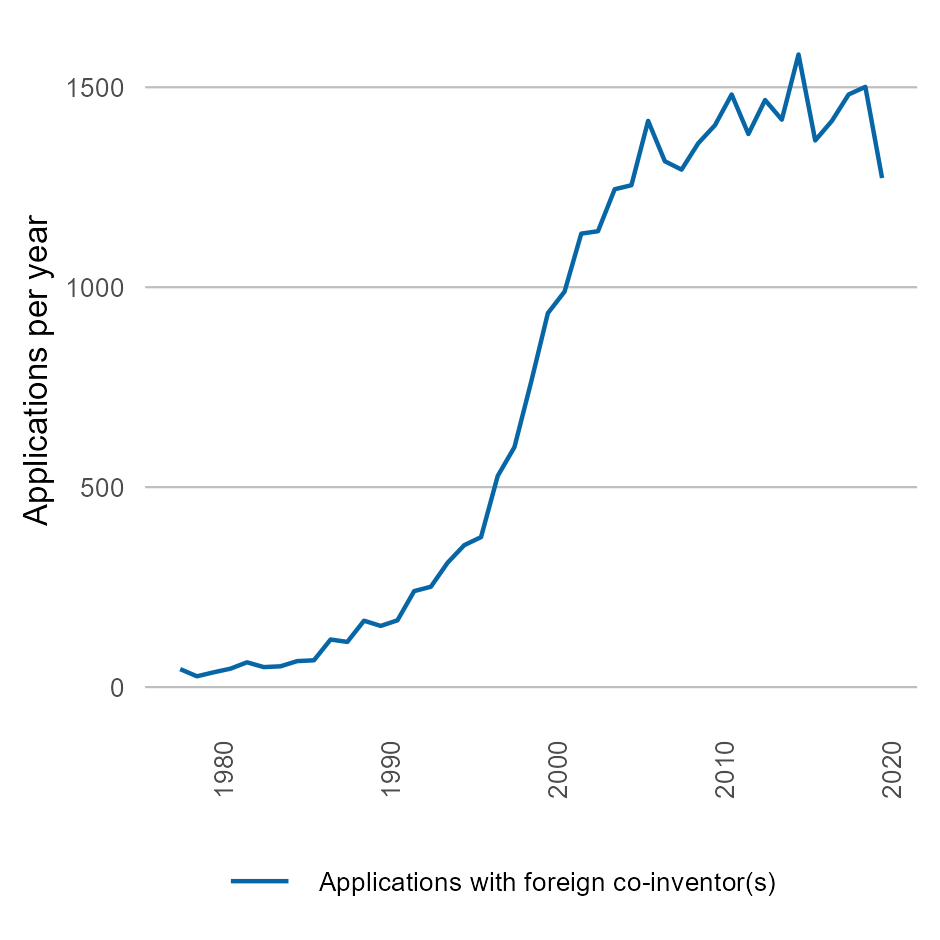
Foreign co-invention patents are an indicator of international innovation collaboration. Source: OECD 2024
Show text version
This chart shows the number of patent applications, submitted by Australian inventors that also had at least on co-inventor located abroad from 1978 to 2020.
The number of foreign co-invention patent applications has increased from 45 in 1978 to 1273 in 2020. See the full chart value of the data.
Chart values
| Year | Applications | Year | Applications |
|---|---|---|---|
| 1978 | 45 | 2000 | 935 |
| 1979 | 27 | 2001 | 989 |
| 1980 | 37 | 2002 | 1134 |
| 1981 | 46 | 2003 | 1140 |
| 1982 | 62 | 2004 | 1245 |
| 1983 | 50 | 2005 | 1255 |
| 1984 | 52 | 2006 | 1416 |
| 1985 | 65 | 2007 | 1315 |
| 1986 | 67 | 2008 | 1294 |
| 1987 | 119 | 2009 | 1360 |
| 1988 | 113 | 2010 | 1405 |
| 1989 | 166 | 2011 | 1482 |
| 1990 | 153 | 2012 | 1383 |
| 1991 | 167 | 2013 | 1468 |
| 1992 | 240 | 2014 | 1419 |
| 1993 | 251 | 2015 | 1582 |
| 1994 | 311 | 2016 | 1367 |
| 1995 | 355 | 2017 | 1416 |
| 1996 | 375 | 2018 | 1482 |
| 1997 | 528 | 2019 | 1501 |
| 1998 | 600 | 2020 | 1273 |
| 1999 | 763 |
| Year | Natural Science | Medical, Health | Engineering, Technology | Social Science | Agricultural, Veterinary | Humanities, the Arts |
|---|---|---|---|---|---|---|
| 2000 | 35.61 | 29.09 | 23.06 | 20.49 | 25.74 | 6.32 |
| 2001 | 37.78 | 30.05 | 24.58 | 22.93 | 27.47 | 6.54 |
| 2002 | 40.21 | 32.54 | 28.37 | 24.57 | 31.53 | 7.24 |
| 2003 | 38.42 | 33.2 | 27.21 | 24.22 | 29.63 | 6.4 |
| 2004 | 40.13 | 35.85 | 30.03 | 23.25 | 31.09 | 5.81 |
| 2005 | 39.98 | 35.2 | 28.08 | 20.47 | 34.61 | 10.72 |
| 2006 | 44.24 | 36.22 | 37.46 | 21.8 | 36.02 | 10.91 |
| 2007 | 46.26 | 36.6 | 37.99 | 22.15 | 36.29 | 8.06 |
| 2008 | 49.02 | 38.08 | 40.44 | 23.08 | 40.39 | 10.14 |
| 2009 | 48.23 | 40.97 | 42.75 | 24.68 | 40.97 | 8.65 |
| 2010 | 51.67 | 41.69 | 43.83 | 25.62 | 42.41 | 13.17 |
| 2011 | 52.89 | 42.86 | 46.42 | 27.29 | 44.51 | 11.92 |
| 2012 | 55.85 | 43.2 | 46.48 | 27.62 | 48.01 | 11.64 |
| 2013 | 55.71 | 45.34 | 48.15 | 28.99 | 47.97 | 12.09 |
| 2014 | 57.61 | 46.71 | 52.4 | 31.41 | 50.58 | 14.96 |
| 2015 | 59.97 | 48.81 | 55.08 | 32.32 | 50.85 | 13.76 |
| 2016 | 63.5 | 51.26 | 58.62 | 35.15 | 54.89 | 17.08 |
| 2017 | 65.55 | 53.3 | 62.61 | 37.1 | 58.43 | 19.02 |
| 2018 | 68.12 | 54.22 | 65.81 | 38.33 | 60.17 | 20.75 |
| 2019 | 69.82 | 55.71 | 67.59 | 41.4 | 63.26 | 20.61 |
| 2020 | 70.84 | 57.45 | 70.63 | 44.53 | 65.41 | 22.8 |
| 2021 | 71.41 | 58.64 | 71.25 | 46.87 | 65.12 | 23.02 |
| 2022 | 72.24 | 57.79 | 72.88 | 48.03 | 68.37 | 25.19 |
| 2023 | 72.33 | 58.68 | 73.22 | 48.4 | 66.22 | 26.34 |
| 2024 | 72.94 | 58.86 | 74.25 | 49.43 | 66.34 | 26.25 |