Resources and energy quarterly: September 2026

Date published:
2 October 2026

The September 2026 Resources and energy quarterly (REQ) contains the Office of the Chief Economist’s forecasts for the value, volume and price of Australia’s major resources and energy commodity exports.

The publication provides:

  • a 5-year outlook for global commodity prices, demand and supply
  • up-to-date global production and consumption data
  • forecasts for Australian production, exports, volumes and prices of key resources and energy commodities
  • detailed statistical tables.

Overview

The forecasts for Australia’s resource and energy commodity exports in 2026–27 and 2027‍–‍28 have been revised upwards modestly from the June 2026 REQ. The recent surge in energy prices due to the Middle East conflict is expected to abate during the outlook period. Modest falls in export earnings are forecast from 2026–27 to 2030–31.

  • Resource and energy export earnings are forecast to lift from $403 billion in 2025–26 to about $422 billion in 2026–27. Export earnings are then expected to fall to $391 billion in 2027–28 and then drift down further to $379 billion ($343 billion in real terms) in 2030–31.
  • The Middle East conflict is expected to weigh on global economic growth in the short term. However, strong investment is likely to support growth in the first half of the outlook period. World growth is forecast to be 2.9–3.0% in 2026, rising to 3.4% in 2027 and then 3.1–3.2% over the rest of the outlook period. Investment will be driven by spending on artificial intelligence (AI) infrastructure, efforts to strengthen supply chain resilience and the energy transition.
  • Gold export earnings are forecast at ~$68 billion over the next few years overtaking LNG to become Australia’s second largest export in terms of value, with iron ore remaining the largest export in the outlook period. Rising diesel prices create risks for mining and transport costs, although low-cost Australian producers could benefit if higher-cost overseas supply is curtailed.

This publication assumes global oil supply remains sufficient to meet demand while Middle East export flows gradually recover, in a central or baseline scenario.

An alternative prolonged disruption scenario examines the effects of tighter inventories, higher energy prices and demand destruction. In this scenario the longer period of elevated prices leads to stronger export earnings for Australian energy commodities.
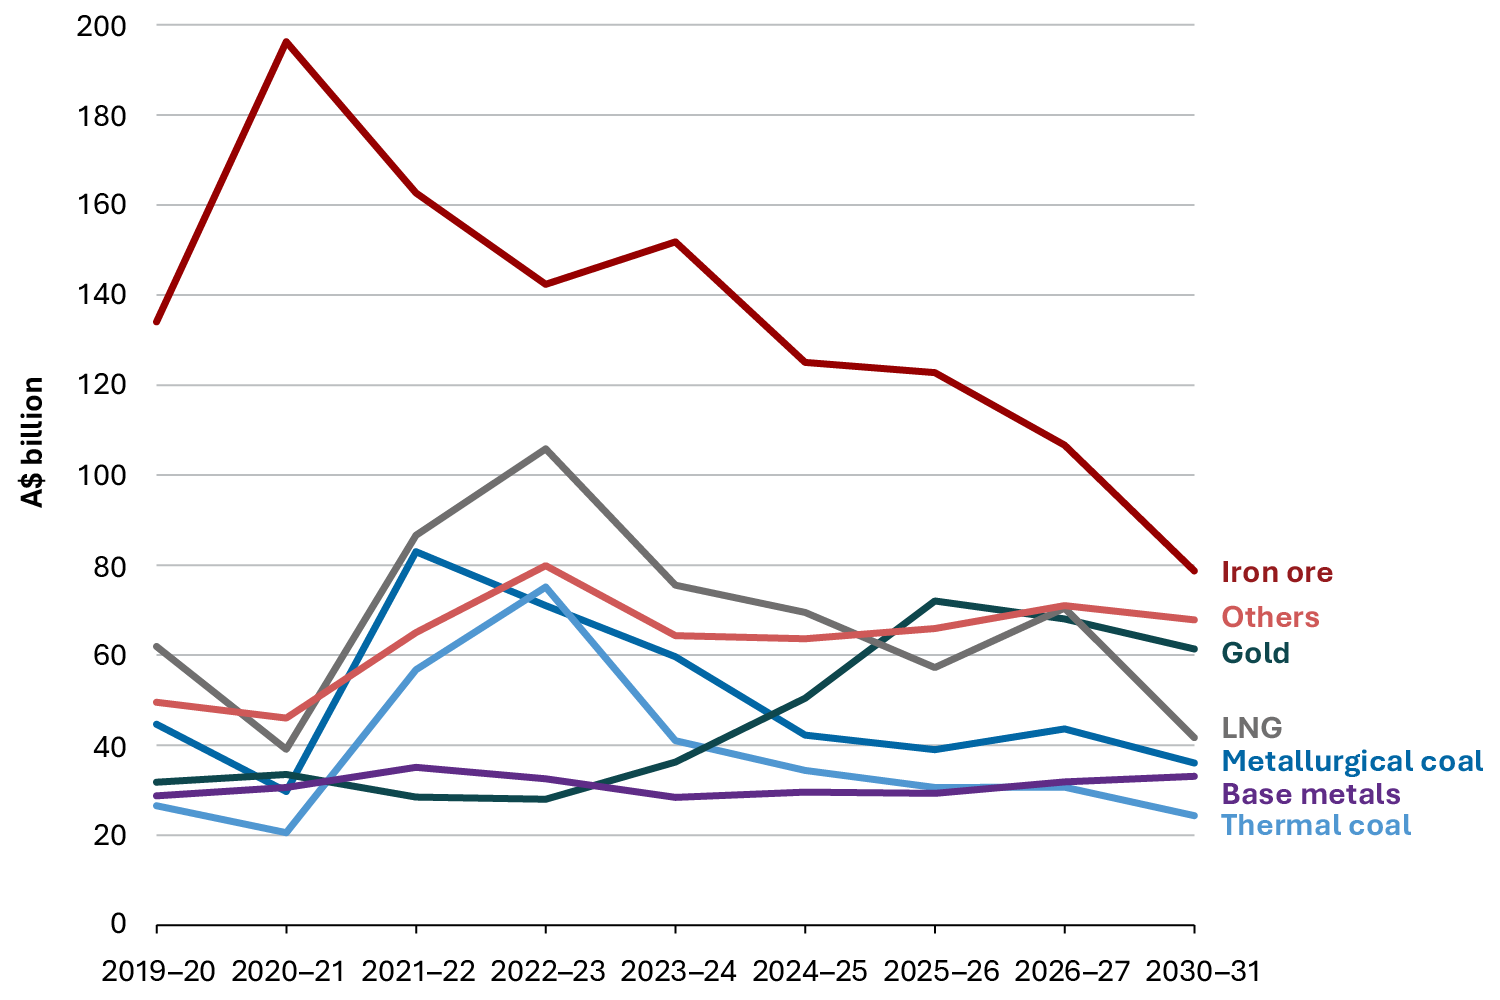
REQ September 2026 chart - commodity values

Macroeconomic outlook

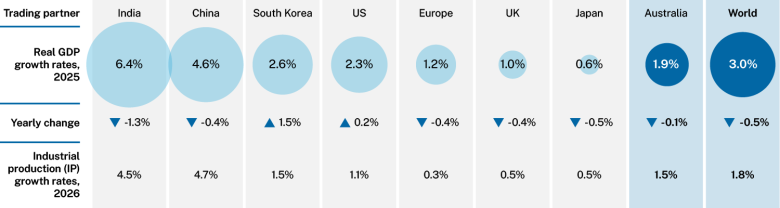
In July 2026, the IMF projected global economic growth of 3.0% in 2026 and 3.4% in 2027. This was a downgrade of 0.1 of a percentage point in 2026 and an upgrade of 0.2 of a percentage point in 2027 from the April 2026 World Economic Outlook (WEO). In these projections, the IMF assumed the reopening of the Strait of Hormuz would begin in mid-July, with conditions broadly returning to the pre-war state of affairs by March 2027.

  • The global economy is growing at a slower pace than in 2025. The impacts of the Middle East conflict have been broadly offset by surging investment in AI infrastructure. Growth is projected to pick up from 3.0% in 2026 to 3.4% in 2027 and then settle at 3.1% over the rest of the outlook period as trade and energy flows normalise.
  • Global inflation is expected to continue to rise in 2026 owing to the Middle East conflict, before easing below 4% from 2027.
  • Growth among Australia’s major trading partners remains comparatively resilient, although higher energy costs, inflation and disruptions to trade present downside risks. Growth has been supported by resilient exports in China and other North Asian countries, sustained economic growth in the US and strong industrial production (IP) and services sector expansion in India.
REQ September 2026 chart - macroeconomic outlook

Iron ore

Iron ore prices came under pressure in the September 2026 quarter as seasonally weaker construction, low steel margins and elevated Chinese port inventories softened demand. Strong exporter shipments and rising supply, including from Simandou, reinforced expectations of a well-supplied seaborne market.

  • Global steel production is forecast to approach 2 billion tonnes by 2031, as lower output in China is offset by stronger production in India, Southeast Asia and the US.
  • Australian iron ore export volumes rose 4.4% year-on-year in the June quarter 2026. Output is forecast to rise modestly over the next 2 years before declining, as new supply largely offsets mine depletion.
  • Iron ore prices are forecast to fall as global supply rises and demand weakens. This is expected to reduce Australia’s export earnings from $107 billion in 2026–27 to $96 billion in 2027–28 and $79 billion by 2030–31 (all in real terms, base 2026–27).
REQ September 2026 chart - iron ore

Metallurgical coal

Australia’s metallurgical coal export volumes are expected to increase by around 1% per annum to 2030–31, supported by steady global steel demand. Import demand is expected to grow strongly in India and Southeast Asia.

  • Metallurgical coal prices are expected to fall from currently elevated levels before stabilising in real terms over the outlook period to 2031, with supply and demand broadly in balance.
  • Export volumes are forecast to increase to 164 million tonnes (Mt) in 2028–29 before easing to 160 Mt in 2029–30 and 158 Mt 2030–31.
  • Export earnings are expected to fall from $44 billion in 2026–27 to $36 billion in 2030–31 (in real terms).
REQ September 2026 chart - coal

Thermal coal

Thermal coal prices are expected to remain elevated while disruptions to LNG supply support demand for thermal coal. This is due to ongoing trade disruptions in the Middle East.

  • Prices are expected to return to pre-conflict levels by mid-2027. Over the outlook period, real prices are expected to be broadly stable from 2028 to 2031 as demand and supply gradually decline.
  • Export volumes are forecast to fall gradually from 209 Mt in 2025 to 199 Mt in 2031. Demand from key importers of Australian thermal coal is expected to moderate as they prioritise decarbonisation and domestic energy security.
  • Export earnings are forecast to fall from $31 billion in 2026–27 to $24 billion in 2030‍–31 (in real terms), as prices ease from elevated levels and export volumes gradually decline.
REQ September 2026 chart - coal

Gas

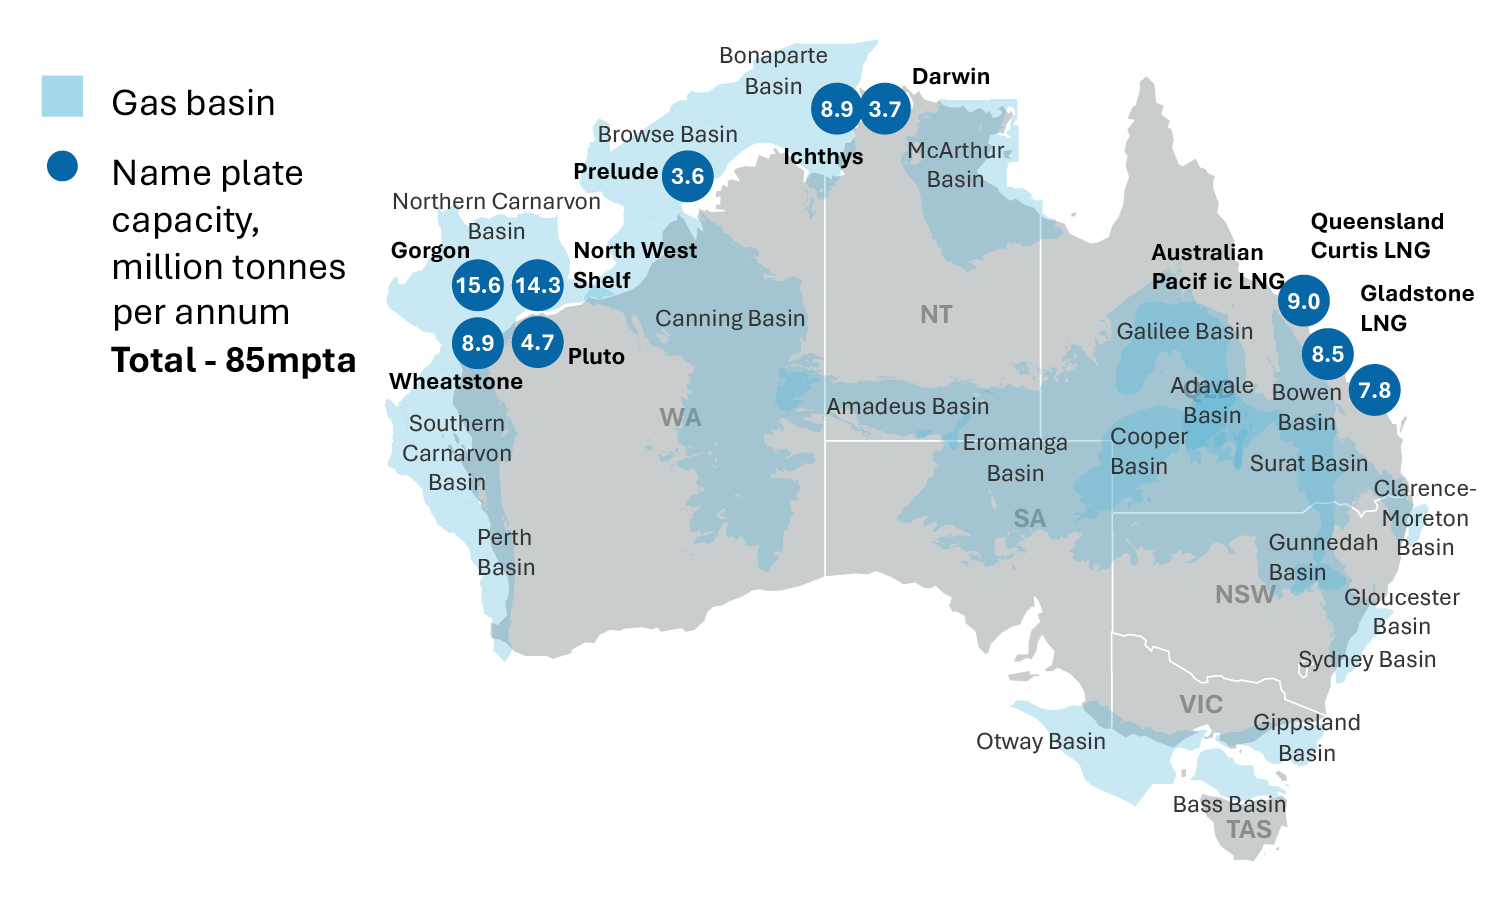
Middle East trade disruptions have pushed LNG prices up in the near term and raised price expectations over the outlook period.

  • Competition among LNG buyers has intensified ahead of the northern winter, adding seasonal pressure to markets already strained by the disruption of shipping in the Middle East. LNG prices rose above US$25/MMBtu in September.
  • Higher prices are forecast to push Australia’s export earnings up from $57 billion in 2025–26 to $70 billion in 2026–27. As Middle East supply and trade conditions normalise, export values are projected to decline to $42 billion (in real terms) by 2030–31.
  • LNG spot prices are forecast to decline from US$18.30/MMBtu in 2026 to around US$8.50/MMBtu (in real terms) by 2031 as US supply grows and Qatari output recovers. Further damage to LNG and gas infrastructure in the Middle East remains the primary risk, with significant potential to push prices up from this baseline.
REQ September 2026 chart - gas

Oil

The conflict in the Middle East has resulted in high prices and extreme volatility. Australia’s short run export values are expected to remain elevated through 2026 and 2027. In outer years of the forecast, earnings are expected to fall as volumes and prices fall.

  • Oil prices remain elevated above US$100 a barrel at time of writing, as the conflict in the Middle East continues to restrict exports from several major oil producers.
  • Oil prices are expected to remain elevated in the near term because of conflict-related trade disruptions in the Middle East. They are then expected to decline and stabilise at around US$65 a barrel (in real terms) through to the end of the outlook period.
  • World supply is forecast to remain broadly steady from 2027 at around 108 million barrels a day, as long-anticipated supply from the Americas comes online.
  • Australian export earnings are forecast to fall from $10.9 billion in 2025–26 to $5.6 billion in 2030–31 (in real terms) as volumes and prices fall.
REQ September 2026 chart - oil

Uranium

Global uranium demand continues to increase as the demand for nuclear energy strengthens, lifting prices. As a result, Australia’s uranium export earnings are expected to rise to $1.8 billion in real terms by the end of the outlook period.

  • Uranium prices are expected to rise from US$89 a pound in 2026 to average US$104 (in real terms) in 2031.
  • The rollout of new nuclear reactors and their initial fuel loads is projected to increase uranium consumption particularly in India and China from 97 Kt in 2026 to 107 Kt in 2031, driven by increased demand for low-carbon-emissions energy.
  • Australian export values are projected to rise from $1.7 bn in 2025–26 to around $1.8 bn (in real terms) in 2030–31.
REQ September 2026 chart - uranium

Gold

Australia’s gold export earnings have been revised down to $68 billion in 2026–27 and 2027–28 due to modest revisions to price forecasts and the AUD/USD exchange rate. Thereafter, export earnings are projected to be steady in nominal terms ($61 billion in 2030–31 in real terms), as lower prices offset increased export volumes.

  • Prices eased to US$4,000 an ounce in July but have since rebounded as fears of a sharp rise in US official interest rates eased. From an estimated average of US$4,400 an ounce in Q3 2026, the price will remain high in 2027, before falling to US$3,760 an ounce (real terms) in 2031.
  • Gold demand is expected to be firm in H2 2026 as investors seek safe havens and US dollar alternatives. Demand is then expected to remain broadly steady over the outlook period.
  • Global mine supply is forecast to remain broadly steady in 2026 before increasing gradually through to 2031, as new mines come onstream and existing mines lift output.
  • Export earnings are forecast to decline from $72 billion in 2025–26 to $68 billion in 2026–27 and then drift down to around $61 billion (all in real terms) in 2030–31.
REQ September 2026 chart - gold

Aluminium, alumina and bauxite (AAB)

Australia’s AAB export earnings are projected to rise modestly in nominal terms over the outlook period but be steady at $20 billion in real terms. The outlook has improved since the June 2026 REQ, driven by a recovery of aluminium production in the Middle East.

  • Aluminium’s fundamentals remain supportive of the aluminium price, with low aluminium stocks and market deficits in 2026 and 2027. The LME aluminium price is forecast to average US$3,335 and US$3,210 a tonne in 2026 and 2027. Further out, the price will be supported by higher demand for the artificial intelligence (AI) buildout and the energy transition. The aluminium price projection for 2028–‍31 averages US$2,900 a tonne (real terms).
  • An improved outlook for primary aluminium production in the Middle East has lifted the outlook for the alumina price in 2026 and 2027. After 2027, a further recovery in global aluminium production will boost alumina demand and hence the price. The alumina price is projected to remain around US$360 a tonne in real terms over the outlook period.
REQ September 2026 chart - bauxite

Copper

Australia’s export earnings are projected to increase from $14 billion in 2025–‍26 to $19 billion (all in real terms) in 2030–31, driven by higher prices and increased export volumes.

  • LME copper prices stayed high in Q2 2026 and then surged to record highs of over US$14,700 a tonne in early September. Factors included high US imports (on US tariff expectations) and a tight concentrate market resulting from mine disruptions and the DRC’s concentrate export ban.
  • Prices are forecast to average US$13,570 a tonne in 2027 before easing to US$11,600 a tonne (in real terms) in 2031.
  • Global copper demand is expected to remain strong through to 2031, driven by demand for clean energy technologies, data centres and broader electricity infrastructure. Supply is expected to grow gradually due to mine disruptions, trade and supply chain challenges, and delays to new mines.
REQ September 2026 chart - copper

Nickel

Nickel prices recovered in the first half of 2026, driven by supply disruptions and concerns over Indonesian ore availability. Prices are expected to ease from current levels as global nickel supply continues to outpace demand. The market is now forecast to remain in surplus until at least 2033. A gradual recovery in Australian production is expected to support export earnings, which are forecast to reach around $1.6 billion (in real terms) by 2030–31.

  • Sustained growth in global refined nickel supply is expected to keep the market in surplus and limit price gains. Nickel prices are forecast to average around US$17,000 a tonne (in real terms) by 2031. Uncertainty surrounding Indonesia's mining approvals and ongoing conflict in the Middle East could support prices in the short term. However, the long-term outlook remains constrained by strong global supply growth.
  • World nickel demand is expected to grow steadily over the outlook period, supported by stainless steel production and continued growth in battery demand. However, weaker-than-expected growth in China's precursor cathode active material sector has cut demand expectations and contributed to projections of a more persistent market surplus.
  • Weak nickel prices and production curtailments are expected to reduce Australia's nickel export earnings from $1.4 billion in 2025–26 to about $1.2 billion in 2026–27. Higher production from new and restarted operations is expected to support earnings over the outlook period.
REQ September 2026 chart - nickel

Zinc

Zinc prices have risen since June, supported by tight concentrate supply, smelter disruptions and falling LME inventories. Limited mine supply and strong competition for concentrates have kept treatment charges low, increasing concerns about the availability of refined zinc and pushing spot prices higher.

  • Zinc prices reached more than US$4,000 a tonne in September. Prices are forecast to average US$3,452 a tonne in 2026, before easing to around US$2,712 a tonne in real terms (base year 2026) by 2031.
  • Global supply is expected to grow moderately, supported by new smelting capacity in China. Production outside China is also forecast to increase, though growth will be constrained by tight zinc concentrate supply.
  • Australia’s zinc export earnings are forecast to fall by $0.2 billion to $4 billion in 2026–27. Price declines will see further falls to $3.1 billion (in real terms, base year 2026–27) by 2030–31.
REQ September 2026 chart - zinc

Lithium

Lithium prices recovered strongly in the first half of 2026, with spodumene prices more than tripling and lithium hydroxide prices more than doubling compared with the same period in 2025, driven by supply disruptions in China and Zimbabwe and strong demand across the battery supply chain. Spodumene and lithium hydroxide prices are expected to remain elevated in the near term as inventories are rebuilt, before moderating from 2027.

  • Spodumene prices are expected to average around US$2,410 a tonne in 2026 before easing to around US$1,500 a tonne by 2031 as global supply expands. Prices for lithium hydroxide are projected to decline from US$21,100 a tonne to US$16,200 a tonne over the same period in real terms (base year 2026) by 2031.
  • Australian mine output is forecast to grow by around 8.8% a year to 2031, supported by expansions at existing operations and the ramp-up of new projects.
  • Global lithium demand is expected to grow by more than 11% a year to 2031, driven by continued growth in electric vehicle (EV) adoption and battery energy storage system (BESS) deployment.
  • Global lithium supply is forecast to grow by around 7.3% a year to 2031. The market is expected to remain oversupplied in the near term before gradually moving back towards balance by the end of the outlook period.
  • Australia’s lithium export earnings are forecast to increase from nearly $10.2 billion in 2025–26 to over $16.6 billion in 2026–27 driven by higher prices and increased export volumes. These are expected to moderate to around $13.6 billion (in real terms) by 2030–31 as prices ease from current levels.
REQ September 2026 chart - lithium

Other critical minerals

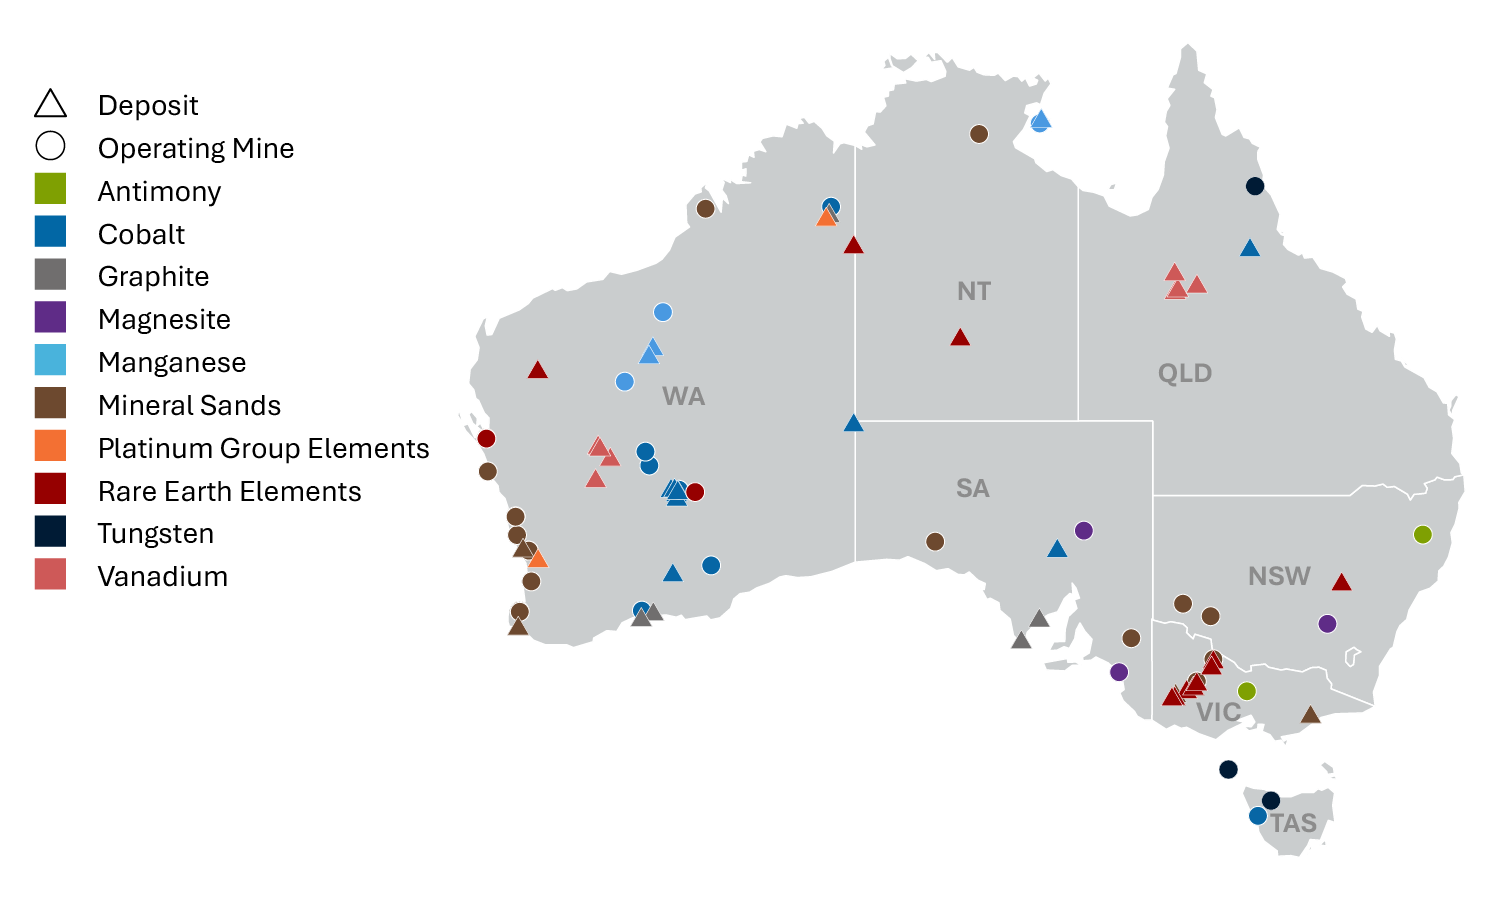
Australia’s export earnings from other critical minerals are expected to increase from $5.5 billion in 2025–26 to $7.2 billion in 2030–31 in real terms. This will see Australia’s total real export earnings from critical minerals (including lithium and nickel) grow to $25 billion in 2026–27. This will ease to $22 billion through to the end of the outlook period.

  • Manganese, mineral sands and rare earths make up the majority of ‘other critical minerals’ export earnings. Rare earth export earnings are expected to be more than triple in nominal terms, led by increased prices and intermediate and refined output.
  • Australian projects continue to receive support from international producers and governments, as efforts to diversify supply chains continue.
REQ September 2026 chart - critical minerals