What do the 2024-25 SRI Budget Tables mean for Australian R&D and innovation

Read analysis on the 2024-25 trends in Commonwealth spending on research and development (R&D).

The 2024–25 Science, Research and Innovation (SRI) Budget Tables show an estimated $14.4 billion in federal Budget commitments towards research and development (R&D) for 2024–25. 

This note unpacks this investment and what it means for the broader innovation system.

The Australian Government’s R&D investments in 2024–25

The SRI Budget Tables capture Australian Government investments in R&D and other science, research and innovation activities. This follows guidance from the Organisation for Economic Co-operation and Development (OECD). Published annually after each Budget, the SRI Budget Tables document funding since 1978–79. 

The government’s $14.4 billion investment in 2024–25 includes $4.3 billion in industry R&D tax measures, and $10.1 billion in other budgetary allocations. Together these represent a 4.7% increase in nominal terms from the $13.8 billion allocated in 2023–24.

The 2024–25 investments are spread over 151 programs and 14 portfolios.

The chart below shows government investment in R&D continues to grow in nominal terms. Investment also remains steady as a percentage of GDP since 2021–22 following a spike during COVID. Government R&D investments in 2024–25 are equivalent to 0.52% of GDP. This is around the average share recorded since 2018–19, but is below the 2021 OECD average of 0.74% (most recent OECD data). 

Australian Government R&D budget allocations

full description follows

Total government Investment in R&D (current prices) is on the left y-axis. Total government Investment in R&D as a proportion of GDP is on the right y-axis. Source: Department of Industry, Science and Resources (DISR)(2024), Science, Research and Innovation Budget Tables 2024–25

Year Government investment ($m) Share of GDP (%)
2014–15 9,834.23 0.61%
2015–16 9,638.09 0.58%
2016–17 9,492.24 0.54%
2017–18 10,190.86 0.55%
2018–19 10,027.40 0.51%
2019–20 10,218.71 0.51%
2020–21 11,932.73 0.57%
2021–22 12,181.95 0.52%
2022–23 13,098.54 0.51%
2023–24 13,767.42 0.51%
2024–25 14,417.37 0.52%

Australian Government investment in R&D by sector

full description follows

Proportions of total government investment in R&D that supports each sector (Government, Business, Higher education and Multisector). Source: Department of Industry, Science and Resources (DISR) (2024), Science, Research and Innovation Budget Tables 2024–25

Year Government sector Business sector Higher education sector Multisector Private non-profit sector Rest of the world sector
2014–15 0.19 0.30 0.36 0.15 0.00 0.00
2015–16 0.20 0.31 0.36 0.13 0.00 0.00
2016–17 0.21 0.29 0.35 0.15 0.00 0.00
2017–18 0.20 0.26 0.35 0.19 0.00 0.00
2018–19 0.21 0.26 0.35 0.17 0.00 0.00
2019–20 0.20 0.26 0.35 0.18 0.00 0.00
2020–21 0.19 0.23 0.38 0.19 0.00 0.00
2021–22 0.19 0.29 0.30 0.22 0.00 0.00
2022–23 0.18 0.32 0.30 0.20 0.00 0.00
2023–24 0.19 0.31 0.30 0.19 0.00 0.00
2024–25 0.17 0.30 0.32 0.20 0.00 0.00

At a sectoral level, the distribution of government R&D investment has remained stable since 2021–22, with some small annual variation. Business and higher education sectors receive the most support. The business sector started receiving a larger share of R&D investment during the pandemic period (2020–21) which was sustained in later years. More detailed data in the SRI Budget Tables shows that most government R&D support for the business sector flows through the R&D Tax Incentive.

In addition to providing funding to support the business and higher education sectors to perform R&D, the federal government also funds R&D that it performs. In 2024–25, this includes separate $0.9 billion investments in the Commonwealth Scientific and Industrial Research Organisation (CSIRO) and the Defence Science and Technology Group.

What do these figures mean for Australia?

R&D is one driver of innovation, which supports economic growth and higher living standards. 

R&D can be risky for businesses and others in the innovation ecosystem, including universities. Government assistance can support and incentivise R&D investment in sectors, delivering benefits to the business and the broader economy. The SRI Budget Tables are one measure of government support for R&D in Australia.

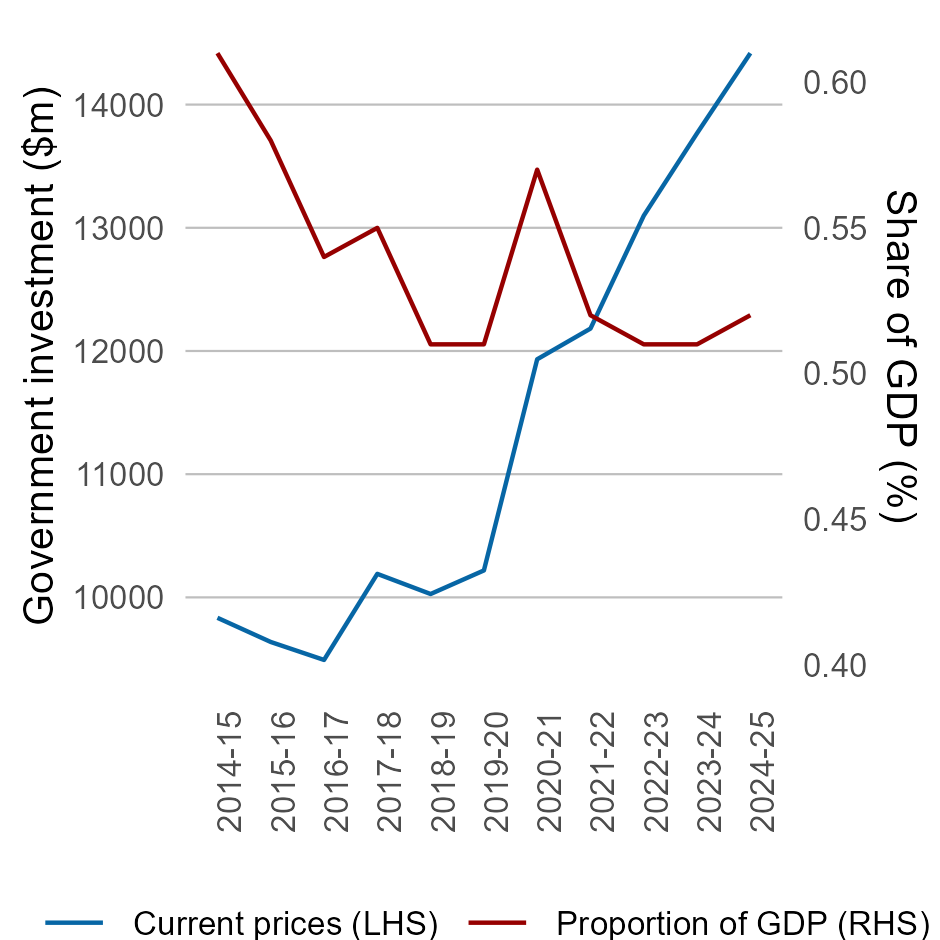
In 2024–25, programs from the following three government portfolios made up the majority of the governments $14.4 billion investment in R&D:

  • Industry, Science and Resources portfolio: $6 billion (up from $5.9 billion in 2023–24), including the R&D Tax Incentive (RDTI)
  • Education portfolio: $4.3 billion (up from $3.8 billion in 2023–24)
  • Health and Aged Care portfolio: $1.7 billion (up from $1.7 billion in 2023–24).

Significant programs or activities from these portfolios include the R&D Tax Incentive ($4.7 billion in 2024–25), Research Training Program ($1.2 billion in 2024–25) and National Health and Medical Research Council (NHMRC) research grants ($1 billion in 2024–25).

The SRI Budget Tables also break down government investments in R&D by socio-economic objective (SEO), which indicate the purpose of the R&D activity, providing insight into the objectives of the government’s R&D funding (OECD 2015). In 2024–25, the top three SEO includes:

  • Industrial production and technology objectives (18.5%)
  • Health (17.9%)
  • General advancement of knowledge: R&D financed from General University Funds (17.4%).

The SRI Budget Tables also show a $1.7 billion investment in ‘other SRI’ activities/programs in 2024–25. These programs do not meet the OECD’s definition of R&D, but otherwise support science, research, or innovation. This includes $284 million in funding for Geoscience Australia, and the government’s investment in PsiQuantum.

Sources

OECD (Organisation for Economic Co-operation and Development) (2015), Frascati Manual 2015, OECD website, accessed 19 August 2024.