What do international indicators say about innovation?

Read analysis on how Australian innovation compares with other countries.

A country’s productivity and economic performance is linked to its innovation (Productivity Commission, 2023). By comparing how well different countries innovate, we can identify opportunities to improve economic performance and drive sustainable growth. 

Many indices have been constructed to enable this comparison. However, there is little agreement on how well Australia performs. Australia ranks in the global top 10 most innovative countries according to some indices but sits outside the top 100 in others. The difference in rankings leads to divergent views on Australia’s innovation performance.

In this insight, we explore how the Australian Innovation Statistics can help us understand the different indices. 

Australia’s performance varies across prominent global indices

First, consider how Australia ranks according to 4 widely cited indices: 

Country Global Innovation Index (GII) Observatory for Economic Complexity’s Research Index Observatory for Economic Complexity’s Trade Index
Australia  23rd 4th 75th
United States 3rd 1st 10th
Canada 14th 3rd 30th
Japan  13th 28th 1st
South Korea 6th 59th 4th

Source: World Intellectual Property Organization (WIPO) (2023), The Observatory of Economic Complexity (OEC) (2024), Harvard University (2025).

In the Global Innovation Index (GII), Australia ranks 23 out of 133 countries (WIPO, 2023). The GII collates 78 variables to assess both innovation inputs, like institutions and human capital, and innovation outputs, like knowledge creation and diffusion in each country. The Australian Innovation Statistics are built on a similar conceptual framework. We track 6 enabling factors of innovation and 3 innovation outcomes across 34 metrics. 

Australia’s GII rank is the result of our strong performance on innovation inputs (18th) and weaker performance on innovation outputs (30th). Australia places below Japan (13th) and Canada (14th). Examining innovation policy in these peer countries, and frontier countries like the United States (3rd), can reveal useful policy approaches. 

Australia’s rankings in common international innovation indicators

full description follows

Source: World Intellectual Property Organization (WIPO) (2023), The Observatory of Economic Complexity (OEC) (2024)Harvard University (2025).

Country Global Innovation Index OEC - Research OEC - Trade Harvard Complexity Index
USA 3rd 1st 10th 15th
Korea 6th 59th 4th 5th
Japan 13th 28th 1st 3rd
Canada 14th 3rd 30th 50th
Australia 23rd 4th 75th 105th

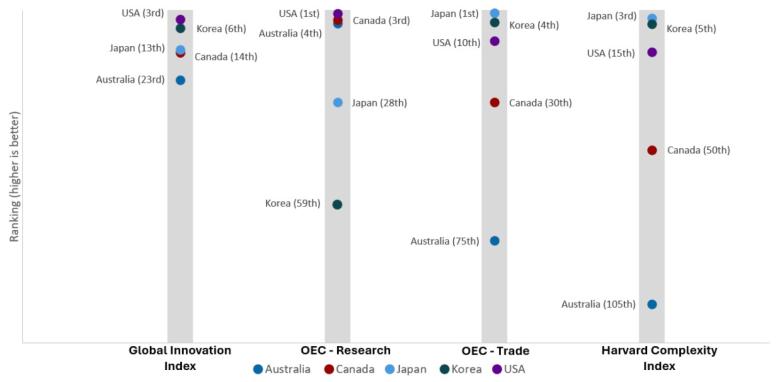
However, Harvard’s Economic Complexity Index ranks Australia 105 out of 145 countries (Harvard University, 2025). Australia sits below all other G20 countries in this ranking. The Observatory for Economic Complexity’s Trade Index ranks Australia similarly (75 out of 132, again last of the G20). 

These export and trade complexity indicators rank countries based on how many products the country exports, and how many other countries export the same products. These indicators are less able to capture the service sector and efficiency of goods production. 

Australia’s service sector is a large part of our economy. However, commodities like iron ore, coal and natural gas account for a large share of our exports. Although we produce these commodities with sophisticated mining processes, they are not unique to Australia. Many of Australia’s niche, sophisticated exports are not captured in these indicators because of their low market share. 

The Observatory for Economic Complexity’s Research Index ranks Australia 4 out of 123 countries, between Canada (3rd) and Japan (28th) (OEC, 2024). Like the other complexity indicators, this index considers the range and uniqueness of countries’ scientific publications. Although only assessing a small part of the innovation system, it highlights Australia’s strong research system.

The Australian Innovation Statistics help us unpack global indices 

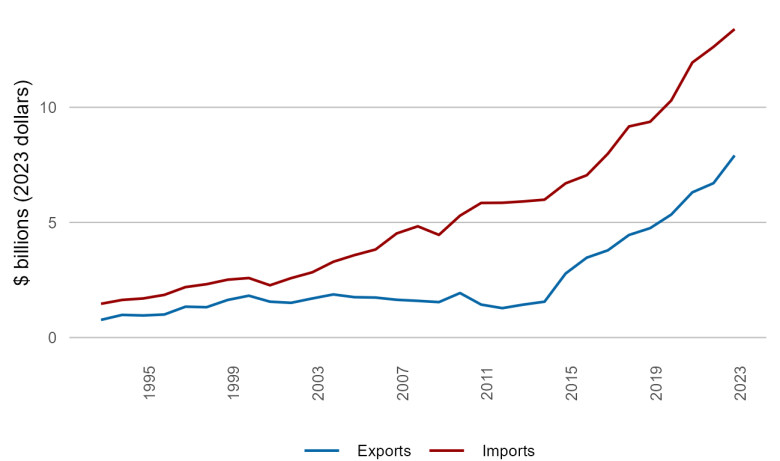
We can use a new metric that we have included in the Australian Innovation Statistics, Australia’s exports and imports of intellectual property, to better understand the global rankings. 

This new metric captures charges for the use of intellectual property. This includes outcomes of R&D, licenses for software use and trademarks licensing fees. It shows that Australia is a net importer of intellectual property. The rapid increase in both imports and exports of intellectual property from 2014 reflects growing trade in licences to reproduce computer services, distribute them, or both. This trend is the result of both the growing role of digital technology in the economy and Australia’s strengths in adopting and developing innovative digital products. 

Exports and imports of intellectual property are growing rapidly

full description follows

Source: Australian Bureau of Statistics (ABS) (2024a & 2024b).

Year Exports ($m, 2023 dollars) Imports ($m, 2023 dollars)
1993 766.9377 1465.087
1994 983.4254 1633.785
1995 959.1281 1698.113
1996 1000 1853.165
1997 1339.779 2191.316
1998 1318.182 2316.819
1999 1632.597 2513.444
2000 1817.204 2584.197
2001 1557.416 2269.637
2002 1507.143 2579.882
2003 1696.078 2831.891
2004 1871.795 3290.682
2005 1752.914 3578.947
2006 1736.735 3824.397
2007 1639.155 4521.622
2008 1594.096 4831.276
2009 1538.7 4458.025
2010 1932.605 5294.118
2011 1430.577 5845.599
2012 1276.923 5852.647
2013 1430.272 5911.175
2014 1556.65 5988.016
2015 2781.818 6697.889
2016 3469.428 7048.969
2017 3788.256 7985.392
2018 4454.545 9168.407
2019 4750.765 9370.69
2020 5340.267 10296.74
2021 6306.61 11944.72
2022 6703.142 12623.24
2023 7908 13394

More broadly, absorbing and diffusing global ideas is an important component of Australia's innovation system. This characteristic is drawn out in several elements of the Australian Innovation Statistics and is rewarded in the Global Innovation Index and the Observatory for Economic Complexity’s Research Index. Notably:

  • Many Australian businesses innovate by adopting existing technology, which includes applying international intellectual property
  • Businesses can use skilled migration to bring new ideas and skills into their work
  • Few Australian businesses indicate that accessing knowledge or technology was a barrier to innovation.  

Each global innovation indicator provides unique insight on different components of Australia’s innovation system, and how it compares to its peers. However, alone they don’t tell the full story. Pairing such indicators with AIS metrics allows us to build a more complete picture about Australia’s innovation ecosystem and future growth opportunities.

Sources

Australian Bureau of Statistics (2024a), Australian System of National Accounts – 2023/24 financial year, ABS website. 

Australian Bureau of Statistics (2024b), Balance of Payments and International Investment Position – Australia, ABS website. 

Harvard University (2025), The Atlas of Economic Complexity, The Growth Lab website, accessed 10 June 2025 

Productivity Commission (2023), 5-year Productivity Inquiry: Keys to growth Inquiry report – volume 2Productivity Commission website. 

The Observatory of Economic Complexity (OEC) (2024), Economic Complexity Index 2023, OEC website.

World Intellectual Property Organization (WIPO) (2023), Global Innovation Index 2024, WIPO website.