Four smiling cafe workers gather around a laptop in their place of business.

The National AI Centre (NAIC) is monitoring how small and medium enterprises (SMEs) use and view AI. We’re looking to understand how SMEs are adopting AI, the opportunities and challenges they face, and the value it brings to their businesses.

We’ve developed the AI Adoption Tracker for organisations working with SMEs to help accelerate their responsible AI journey. 

You can explore trends and data through interactive dashboards on:

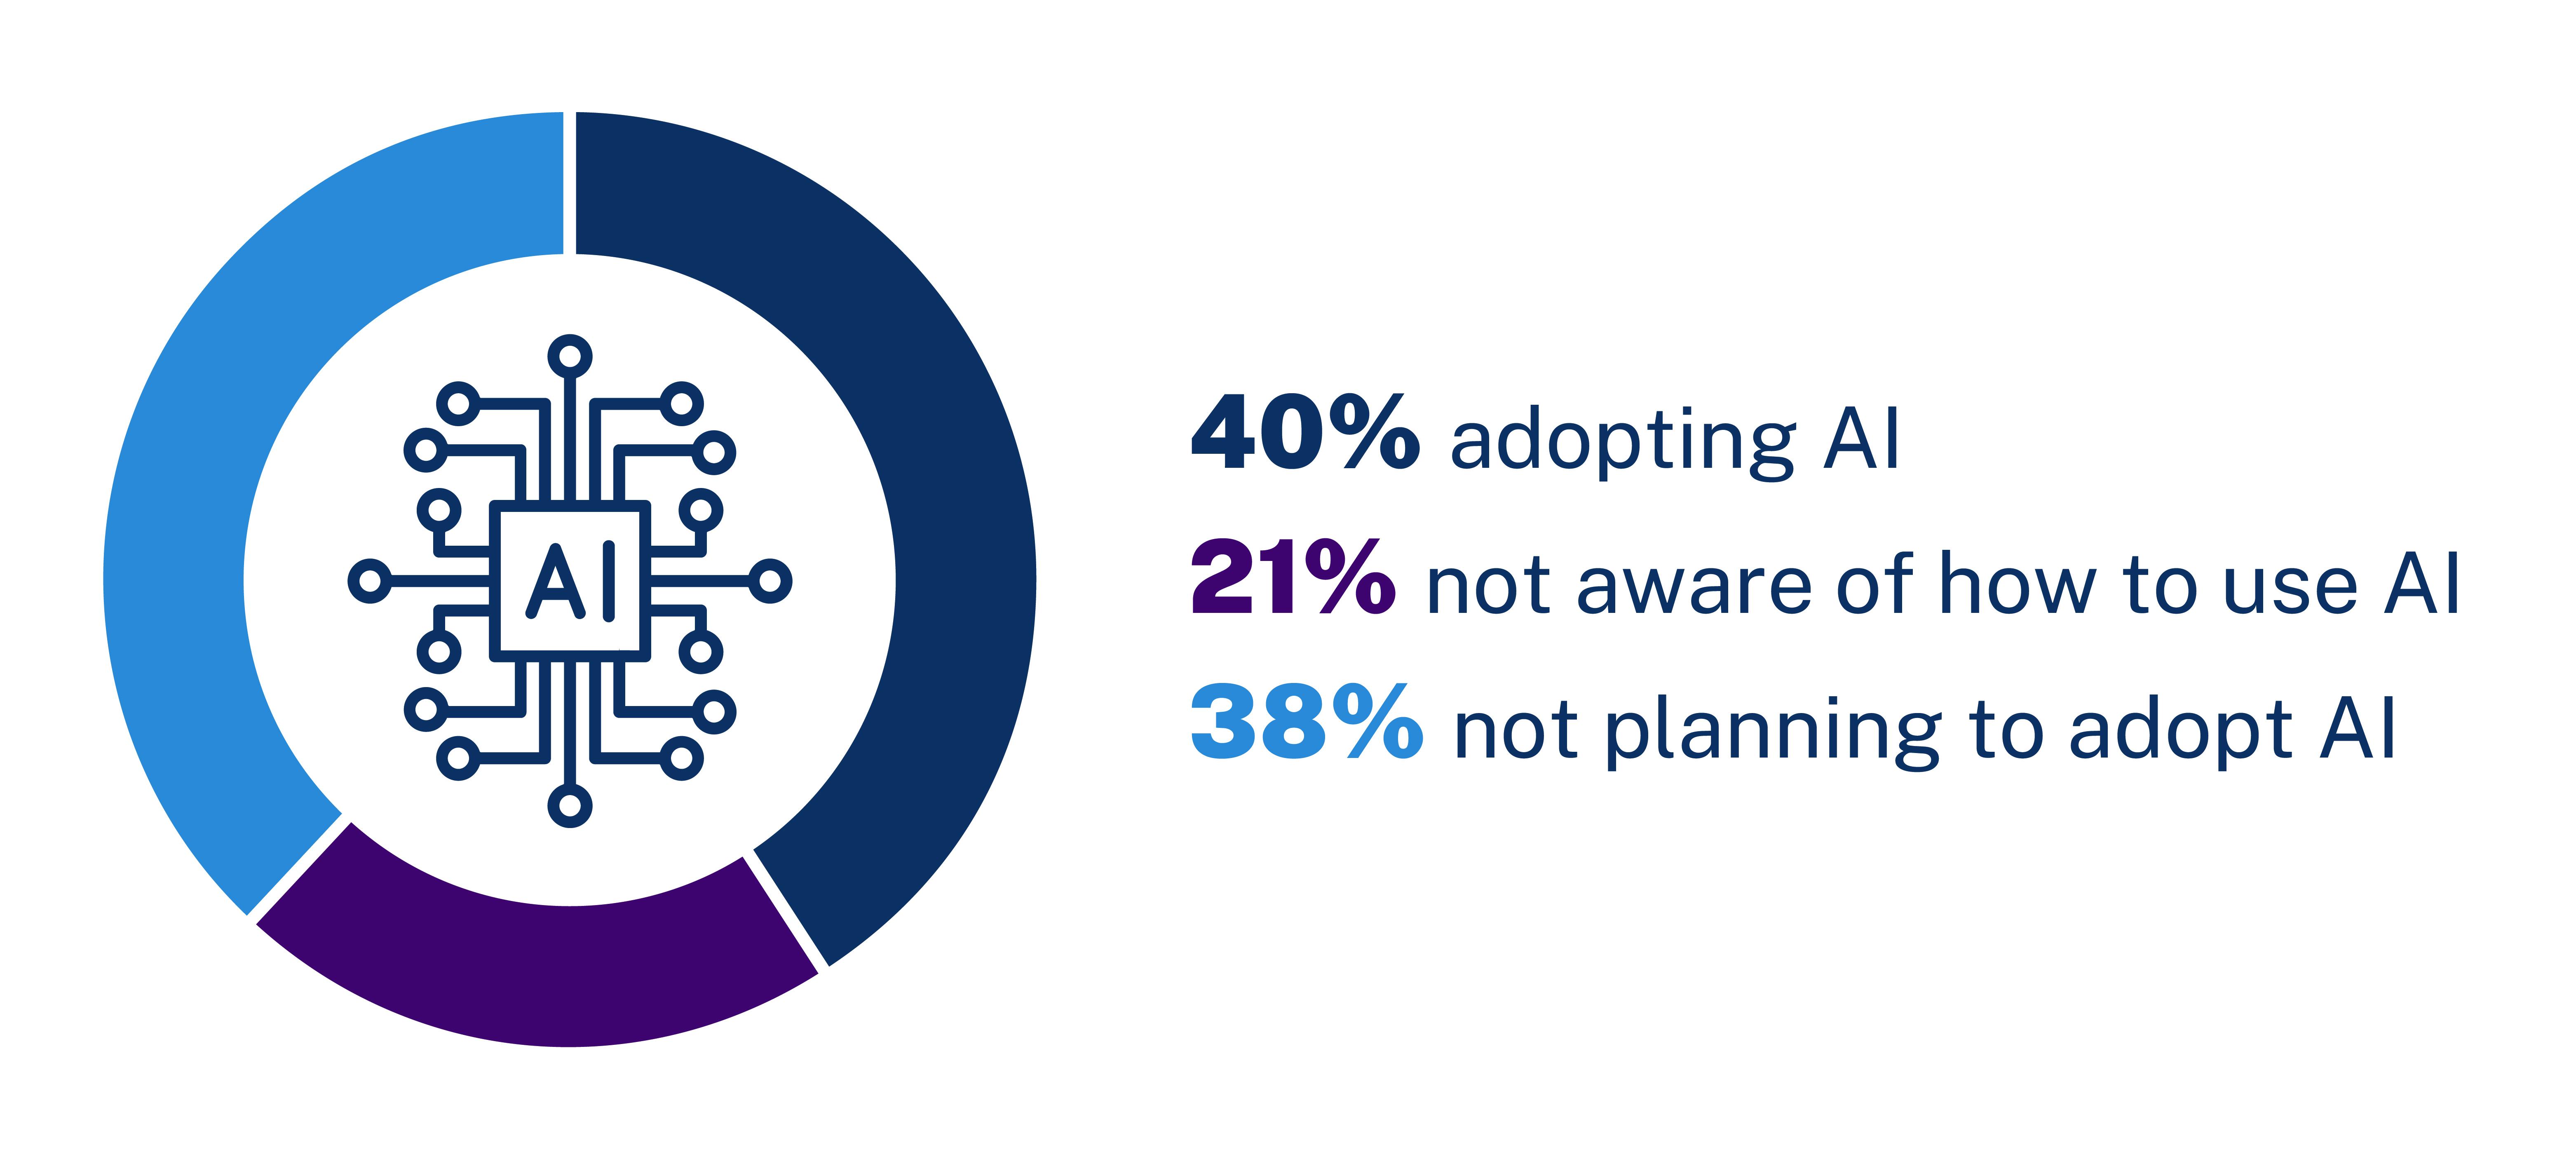
  • AI adoption rates by business size, industry and location
  • awareness and use of different AI applications
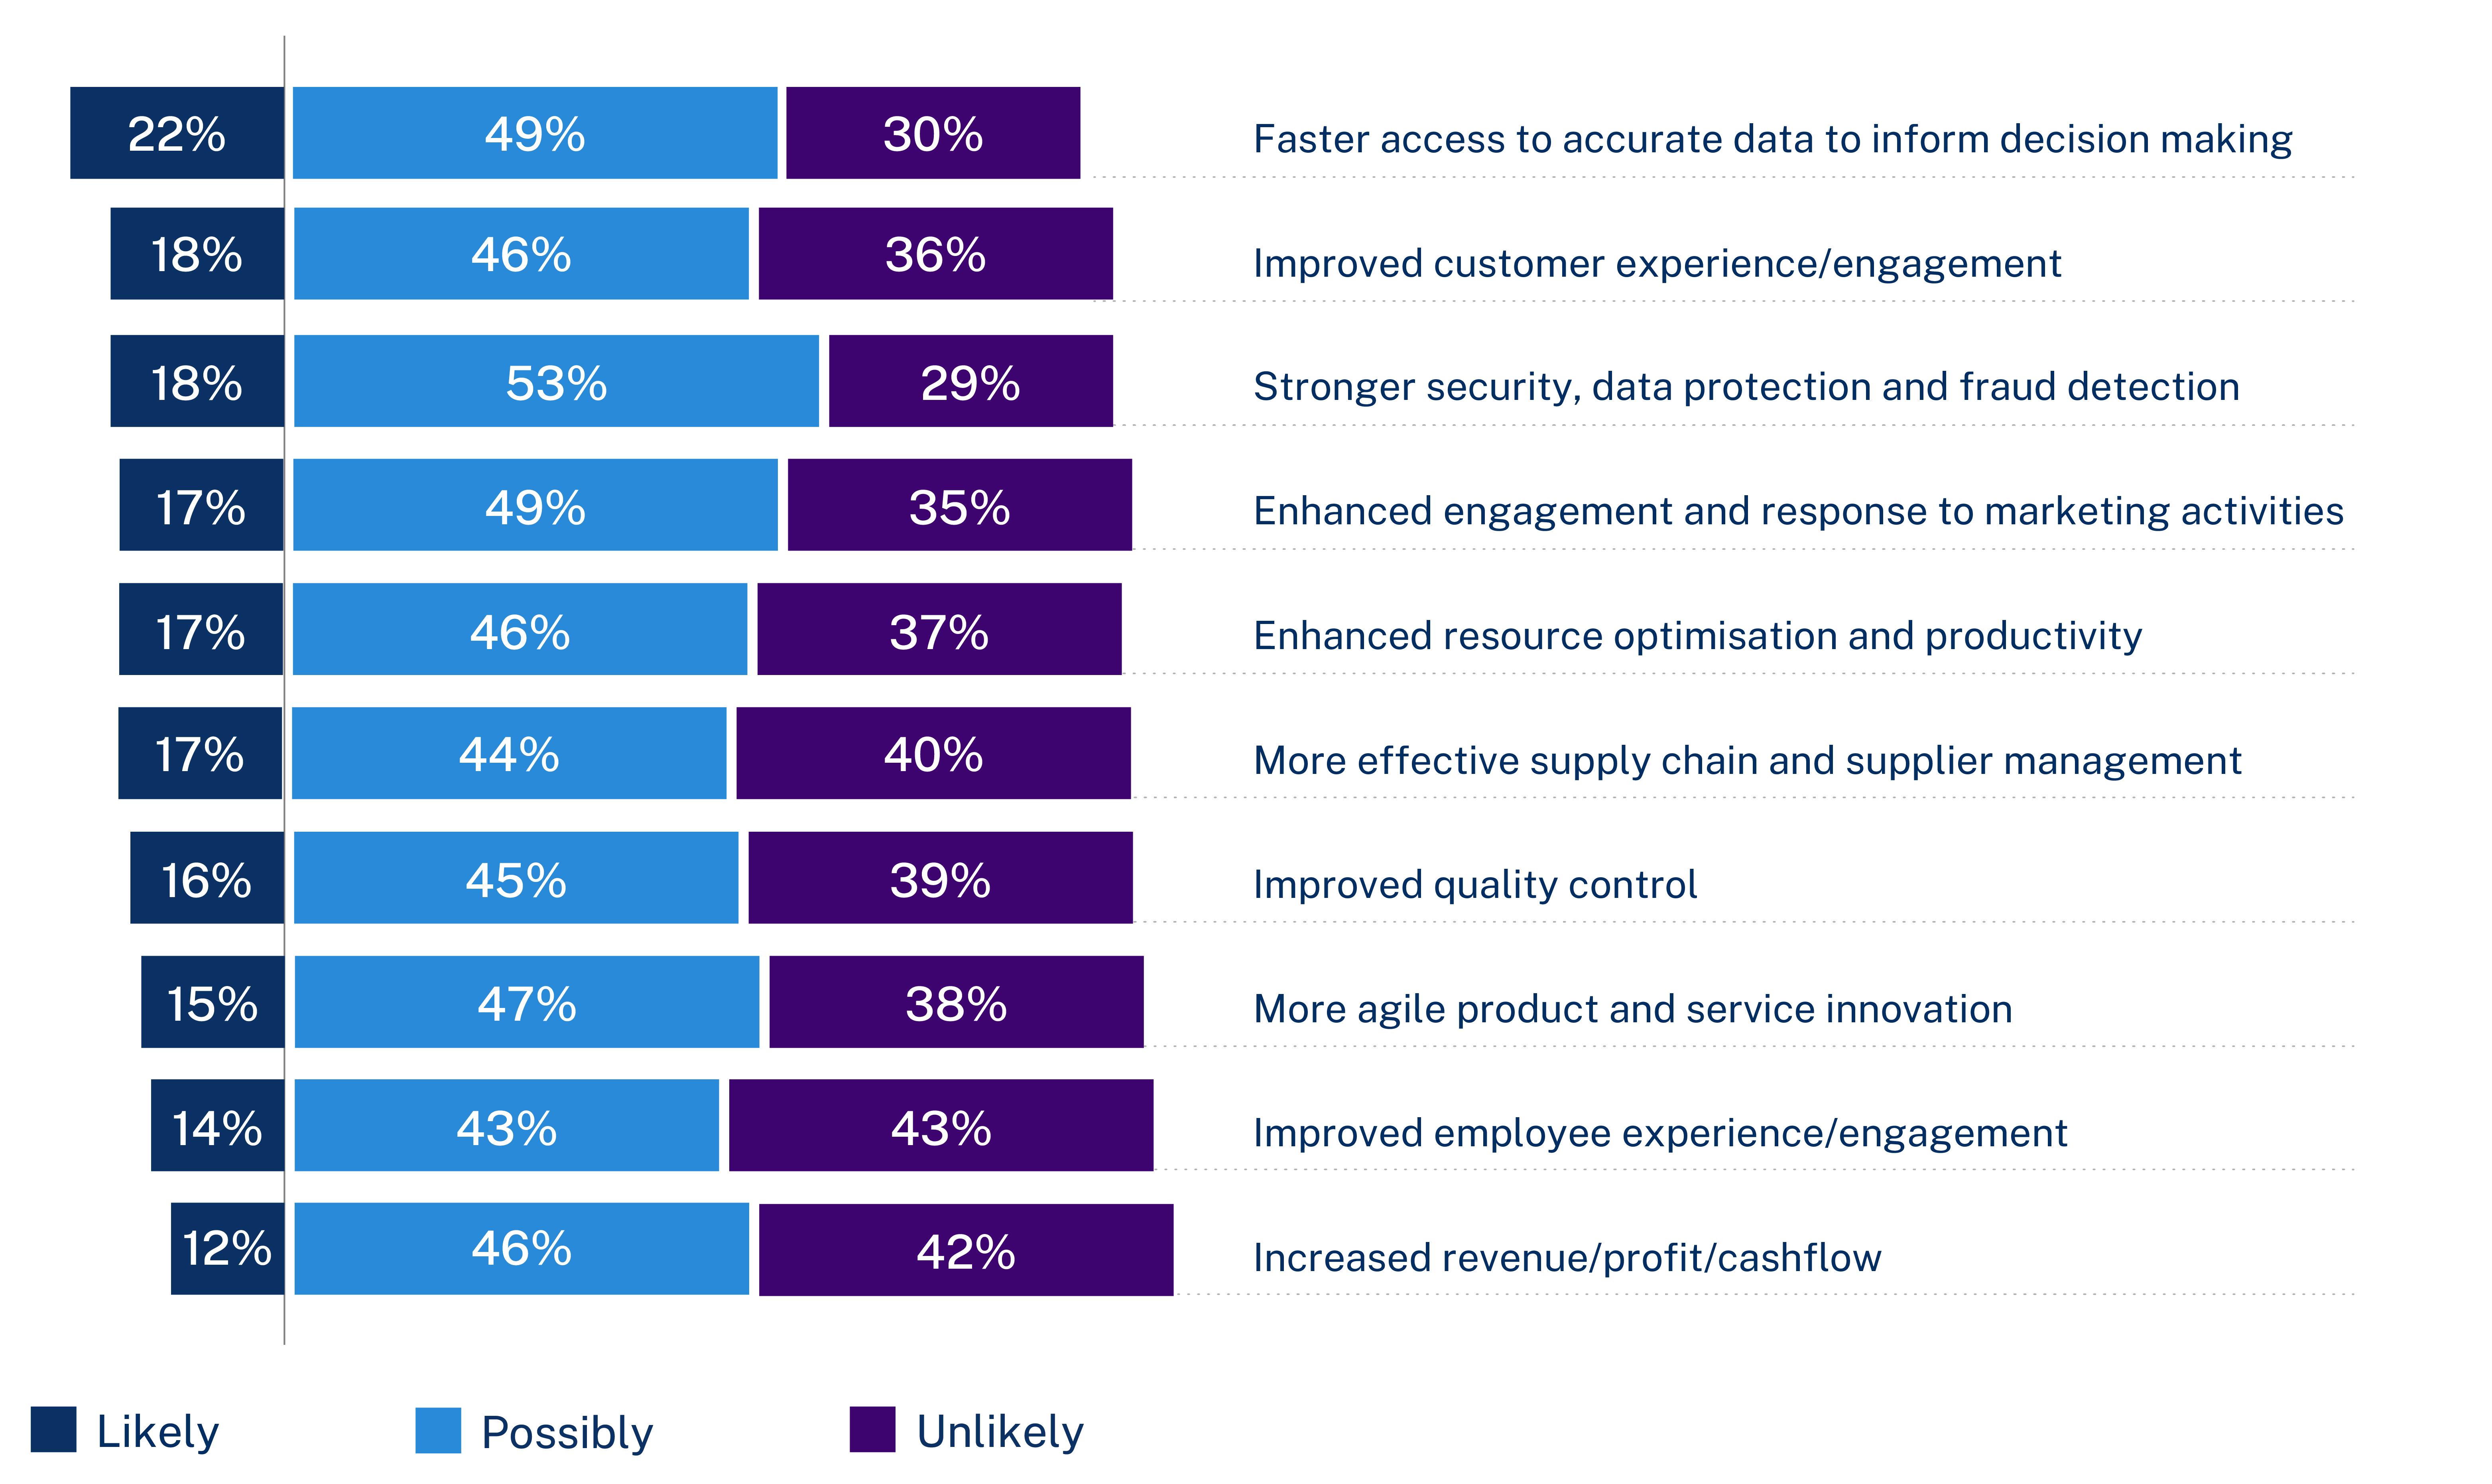
  • perceived business outcomes, benefits and challenges.

We’re working with Fifth Quadrant on ongoing research to survey businesses, with 400 businesses responding each month. Our data starts from May 2024.

We’ll be updating data in the AI Adoption Tracker monthly and sharing quarterly insights about the main findings. 

We’ve summarised findings for October to December 2024 below. We’ve rounded some statistics to make them easier to read.

AI adoption

AI adoption trend infographic shows 40% adopting AI, 38% not planning to adopt AI, 21% no aware of how to use AI.

The data reveals a positive trend in AI adoption among Australian small and medium businesses. 

40% of SMEs are currently adopting AI, a 5% increase compared to the previous quarter (July – Sept 2024). And the proportion of businesses that are not aware of how to use AI has dropped by 2% to 21%. In the smallest businesses – those with up to 4 employees – AI adoption increased from 25% to 34%.

The percentage of SMEs not intending to implement AI in the next 12 months has also fallen to 38%, decreasing by 4%.

Most businesses agree that AI can offer a competitive edge and compelling use cases that can transform their operations.

However, challenges like skills gaps, funding constraints and the rapid pace of technological change remain significant barriers to adoption. Despite these challenges, SMEs are becoming more confident managing regulatory, compliance and governance issues around AI. There is still room for improvement in cybersecurity readiness and responsible AI implementation.

AI adoption by industry

AI adoption by industry infographic. Data shows rate that each industry is adopting, not adopting and not aware in that order. Services (48%, 37%, 15%), Retail Trade (45%, 36%, 19%), Distribution (35%, 32%, 33%), Construction (34%, 41%, 35%), Agriculture, Forestry and Fishing (32%, 37%, 30%), Health and Education (31%, 41%, 28%), Hospitality (31%, 42%, 27%), Manufacturing (30%, 51%, 19%).

Services: 

  • 48% adopting
  • 37% not adopting
  • 15% not aware.

Retail trade:

  • 45% adopting
  • 36% not adopting
  • 19% not aware.

Distribution:

  • 35% adopting
  • 32% not adopting
  • 33% not aware.

Construction:

  • 34% adopting
  • 41% not adopting
  • 25% not aware.

Agriculture, forestry and fishing:

  • 32% adopting
  • 37% not adopting
  • 30% not aware.

Health and education:

  • 31% adopting
  • 41% not adopting
  • 28% not aware.

Hospitality:

  • 31% adopting
  • 42% not adopting
  • 27% not aware.

Manufacturing:

  • 30% adopting
  • 51% not adopting
  • 19% not aware. 

AI adoption varied significantly across industries. 

Overall, the data indicates a positive trend in AI adoption in:

  • retail trade, up by 8% to 45%
  • construction, up by 8% to 34% 
  • agriculture, forestry and fishing, up by 21 % to 32%. 

However, adoption rates decreased in health and education, hospitality, and manufacturing.

AI adoption by state and territory

AI adoption varied significantly across different states from one quarter to the next. 

  • New South Wales increased from 26% to 28%, indicating steady growth in AI integration. 
  • Victoria maintained a stable rate of 27%, showing no change from the previous quarter. 
  • Queensland jumped from 22% to 29%, reflecting growing interest in AI technologies. 
  • Western Australia jumped from 21% to 29%, also reflecting growing interest. 
  • Tasmania increased from 6% to 11%.

These changes underscore the varying levels of AI adoption and the growing recognition of its potential benefits across different states.

There is a significant difference in AI adoption between metro and regional areas, with metro areas showing higher rates. This highlights areas for further research to understand the underlying factors and identify opportunities for increasing AI adoption in regional areas. 

For example, adoption rates are:

  • 34% in NSW metro areas compared to 18% in regional areas
  • 32% in WA metro areas compared to 11% in regional areas.

AI applications

Top 5 AI applications infographic: 1 generative AI assistants, 2 data entry and document processing, 3 fraud detection, 4 marketing automation, 5 customer support and chatbots.

The top 5 applications businesses adopting AI favoured were the same as last quarter, with generative AI assistants moving to top place: 

  • generative AI assistants 
  • data entry and document processing
  • fraud detection
  • marketing automation
  • customer support and chatbots. 

Businesses looking to introduce AI in their business favoured:

  • data entry and document processing
  • fraud detection. 

Industry sectors adopted some AI applications at higher rates:

  • Services, hospitality, distribution and retail trade adopted generative AI assistants 
  • Retail, trade and hospitality led in marketing automation.

Business outcomes

Business outcomes infographic. Data for each statement shows likely, possibly and unlikely in that order. Faster access to accurate data to inform decision making (22%, 49%, 30%). Improved customer experience/engagement (18%, 46%, 36%). Stronger security, data protection and fraud detection (18%, 53%, 29%). Enhanced engagement and response to marketing activities (17%, 49%, 35%). Enhanced resource optimisation and productivity (17%, 46%, 37%). More effective supply chain and supplier management (17%, 44%, 4

SMEs' perception of business outcomes:

  • Faster access to accurate data to inform decision making 
    • 22% likely
    • 49% possibly
    • 30% unlikely.
  • Improved customer experience/engagement
    • 18% likely
    • 46% possibly
    • 36% unlikely.
  • Stronger security, data protection and fraud detection 
    • 18% likely
    • 53% possibly
    • 29% unlikely.
  • Enhanced engagement and response to marketing activities 
    • 17% likely
    • 49% possibly
    • 35% unlikely.
  • Enhanced resource optimisation and productivity
    • 17% likely
    • 46% possibly
    • 37% unlikely.
  • More effective supply chain and supplier management 
    • 17% likely
    • 44% possibly
    • 40% unlikely.
  • Improved quality control 
    • 16% likely
    • 45% possibly
    • 39% unlikely.
  • More agile product and service innovation 
    • 15% likely
    • 47% possibly
    • 38% unlikely.
  • Improved employee experience/engagement 
    • 14% likely
    • 43% possibly
    • 43% unlikely.
  • Increased revenue/profit/cashflow 
    • 12% likely
    • 46% possibly
    • 42% unlikely.

More SMEs believed AI can achieve business outcomes, compared to last quarter.

The top 3 business outcomes they definitely agreed AI could help achieve are:

  • Faster access to accurate data to inform decision making: 22% 
  • Improved customer experience/engagement: 18% 
  • Stronger security, data protection and fraud detection: 18%.

Many businesses feel AI is unlikely to deliver outcomes, particularly:

  • Improve employee experience/engagement: 43%
  • Increase revenue and cashflow: 42%.