| Industry | Import penetration | Export penetration |
|---|---|---|
| Accommodation & Food Services | 14.77 | 11.47 |
| Agriculture, Forestry & Fishing | 2.55 | 29.39 |
|
Information Media & Telecommunications |
16.96 | 7.04 |
|
Manufacturing
|
59.07 | 31.75 |
|
Mining
|
15.27 | 80.76 |
| Transport, Postal & Warehousing | 9.37 | 5.87 |
International trade encourages the exchange and adoption of internationally competitive innovations.
Trade exposure, top 6 industries, 2022–23

Trade exposure encourages the adoption of international competitive innovations. Data updated in August 2025, see the Recent AIS data updates page for details. Source: ABS 2025a
Show text version
This chart illustrates the trade exposure of Australian industries in 2022–23. It indicates that the mining sector has the highest export propensity, followed by the manufacturing and agriculture, forestry, and fishing industries. The manufacturing sector also has the highest import penetration. See the full chart value of the data.
Exports and imports of intellectual property

Australia’s imports of have exceeded its exports of intellectual property since records began. Metric added in August 2025, see Recent AIS data updates page for details. Source ABS 2024b, 2024l
Show text version
This chart shows an increase of Australia's import and export of intellectual property over the past 30 years. See the full chart value of the data.
Foreign Direct Investment in Australia, top 6 industries
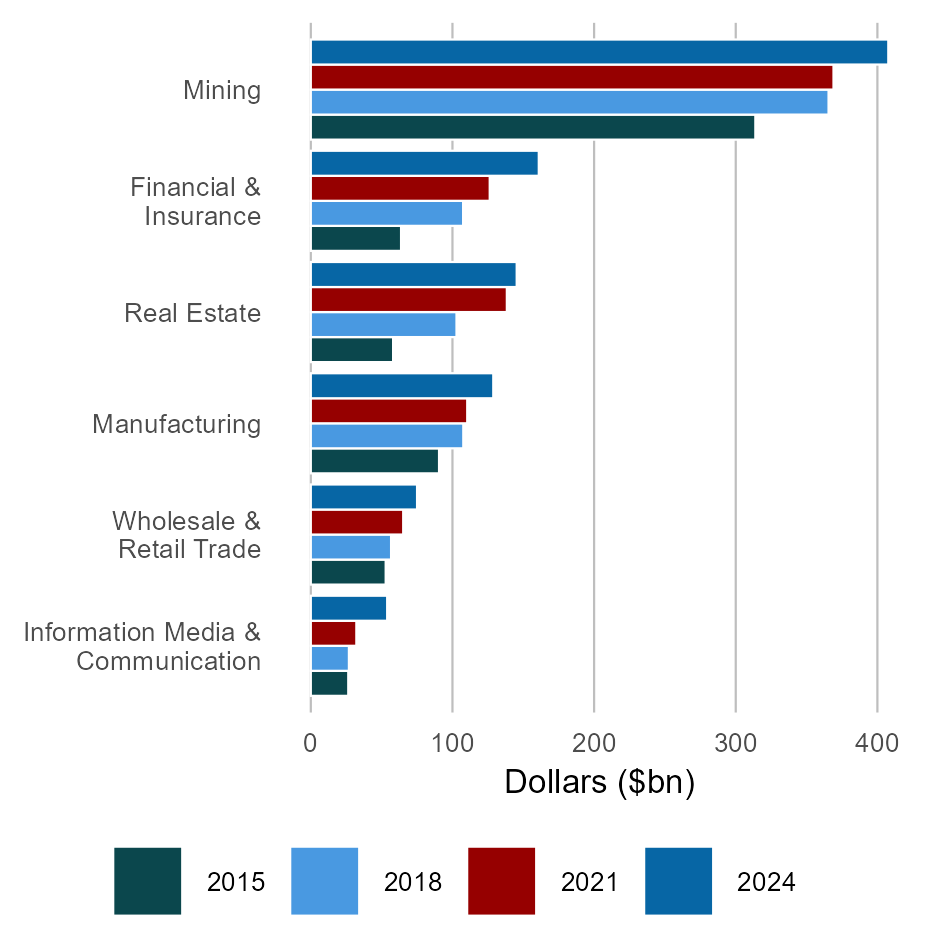
Foreign Direct Investment encourages the introduction of new ideas and technologies from overseas. Data updated in August 2025, see the Recent AIS data updates page for details. Source: ABS 2019d, 2024e, 2025b
Show text version
This chart shows the value of inward foreign direct investment (FDI) across 6 industries from 2015 to 2024.
Across the majority of industries, the amount of inward FDI has increased over this period. The industry with the most inward FDI is mining. The other industries with the largest inward FDI are the financial & insurance and real estate industries. See the full chart value of the data.
Chart values
| Industry | 2015 | 2018 | 2021 | 2024 |
|---|---|---|---|---|
| Mining & Quarrying | 313.831 | 365.516 | 369.012 | 407.699 |
|
Manufacturing
|
90.528 | 107.651 | 110.429 | 128.814 |
| Wholesale & Retail Trade | 52.851 | 56.667 | 65.222 | 75.008 |
| Information, Media & Communication | 26.435 | 26.891 | 32.145 | 53.909 |
| Financial & Insurance | 63.713 | 107.529 | 126.308 | 160.942 |
|
Real Estate
|
58.102 | 102.851 | 138.391 | 145.349 |
| Year | Exports | Imports |
|---|---|---|
| 1993 | 766.9377 | 1465.087 |
| 1994 | 983.4254 | 1633.785 |
| 1995 | 959.1281 | 1698.113 |
| 1996 | 1000 | 1853.165 |
| 1997 | 1339.779 | 2191.316 |
| 1998 | 1318.182 | 2316.819 |
| 1999 | 1632.597 | 2513.444 |
| 2000 | 1817.204 | 2584.197 |
| 2001 | 1557.416 | 2269.637 |
| 2002 | 1507.143 | 2579.882 |
| 2003 | 1696.078 | 2831.891 |
| 2004 | 1871.795 | 3290.682 |
| 2005 | 1752.914 | 3578.947 |
| 2006 | 1736.735 | 3824.397 |
| 2007 | 1639.155 | 4521.622 |
| 2008 | 1594.096 | 4831.276 |
| 2009 | 1538.7 | 4458.025 |
| 2010 | 1932.605 | 5294.118 |
| 2011 | 1430.577 | 5845.599 |
| 2012 | 1276.923 | 5852.647 |
| 2013 | 1430.272 | 5911.175 |
| 2014 | 1556.65 | 5988.016 |
| 2015 | 2781.818 | 6697.889 |
| 2016 | 3469.428 | 7048.969 |
| 2017 | 3788.256 | 7985.392 |
| 2018 | 4454.545 | 9168.407 |
| 2019 | 4750.765 | 9370.69 |
| 2020 | 5340.267 | 10296.74 |
| 2021 | 6306.61 | 11944.72 |
| 2022 | 6703.142 | 12623.24 |
| 2023 | 7908 | 13394 |